Is there precedence for SPX to significantly continue its uncorrected move higher?
Putting the current rally in perspective, the 21% uncorrected gain in SPX since November is now equal to the largest such rally in the last 13 years outside of those following the 2009 low and the Flash Crash.

Recall that the current rally started after a short one-month decline and follows the strong 13% gains in 2013. Therefore, when looking at comparable advances to the current one, we exclude those starting from a major low (2002, 2009) or after a violent fall (the Flash Crash). Rallies after these events are expected to be longer and stronger as pent up demand is released. More on that below.
The ebullient 1990s had several larger rallies than the current one but all were preceded by a five-month or longer down period that primed demand. These long lulls occurred every year during the 1990s and, importantly, set up each subsequent rally. The only exception was 1995, and 1994 was a full year of frustrating, choppy digestion that shook out many bulls. A long lull like these hasn't happened in two years (May-October 2011). Incidentally, all the rallies after 1995 lasted 4 months or less, compared to the 6 months this one has lasted.

So, a larger, uncorrected gain than 21% hasn't occurred since the 1990s and all of those were set up by a digestive period that SPX has not experienced in the last two years. From a cycle standpoint, the current rally appears to be at an outer extension and a digestion period is overdue.
Going back 33 years, SPX has been up more than the current 14% for the full year about a third of the time. So, more gains this year would not be odds-on, but not unusual either.
However, in every year except one (1995), SPX has experienced a 5% or greater drawdown intra-year. In 80% of these years, a drawdown of more than 8% has occurred. At some point in 2013, that should be odds-on.
Assuming that SPX closes at today's level or higher at year's end doesn't reduce the expected drawdown. The chart below shows 12 years (circled) with higher closes that were not preceded by an annual decline. The average drawdown was 11% and minimum was 7%.
In other words, in 33 years, SPX has never gained more than 14% by year end without having a 7% intra-year decline. Those are strong odds.

Timing: In the cases above, 75% of the corrections occurred in 3Q. While the 'sell in May' meme has been buried in the past week, all except one of the above happened between May and October.
Tom Bulkowski has also crunched the probabilities by looking at up months in a row over the past 25 years. The likelihood of a down cycle starting in 2Q is over 90%.

None of this is to say that SPX is headed for a 2000 or 2007 style fall. We are discussing smaller cycles that naturally occur each year, not major cycles that occur every 15-20 years. Strong uptrends like this do not typically end immediately. Going back to 1980, every period where SPX has been up six months in a row has led to higher highs after a smaller down cycle has occurred. Those are the longer term odds.
That said, most of the multi-month rallies started either from a major bottom (red arrows) or after the prior year was flat/down (blue). Until now, there have been only three other multi-month rallies like the current one (green); in two of three, a correction in the following months wiped out more than all the ensuing gains past month six. A small sample, but it confirms Bulkowski's odds that expecting a further uncorrected advance is not odds-on.

Is it possible that investor demand is so pent-up that it pushes indices significantly higher?
There is a lot of talk about this being a 'hated rally' and that 'too many investors are on the sidelines' waiting for a decline. Net margin debt suggests this is not likely. Also, the ratio of assets in ETFs plus mutual funds to cash also suggests this is not likely (below). You can see, by the way, how much more cash was on the sidelines before the 1995 rally than today, and why rallies off major lows are expected to be so much stronger.

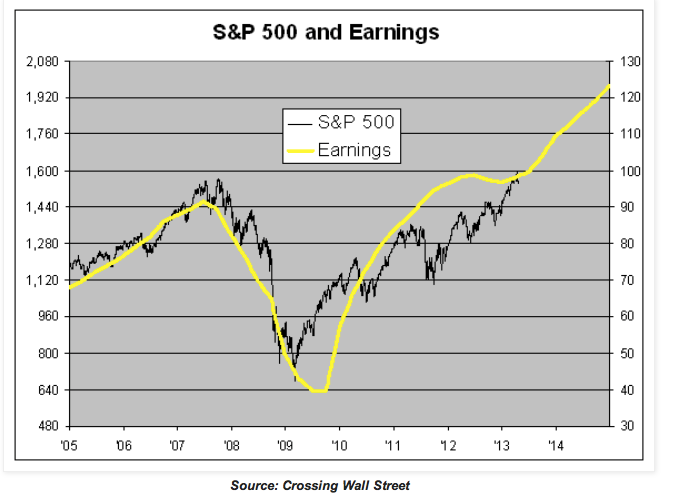
If Wall Street's estimates are a guide, analysts are not bearish either. Despite quarterly EPS being flat since 3Q2011, and barely growing 2% in 1Q2013, they expect ~10% growth later this year and into 2014. Wall Street is very bullish on the SPX.
Finally, fund managers are also not sitting in cash or in bonds. Their exposure to equities is at the high end of the range.

We are the first to acknowledge that 2013 has been a year where precedent has been ignored. It's a message that should be listened to. But cycles are a regular feature of the market and to bet that this year is different is a very long shot.