Thursday, October 31, 2013

The Best Six Months Start Now

The end of the "worst 6 months" in the stock market is upon us. Tomorrow is November 1, when seasonality turns positive.

We last wrote about seasonality in April. Our bottom-line was this: May to October is less bad than you think (post). Median returns since 1970 on SPX are 8% during winter (November to April) and 4% during summer (May to October). "You might sell in May and buy back higher in November."

This summer was exceptionally strong: since May 1, SPX is up almost 11%. This puts it in the top 17% over the past > 40 years.

Below are the SPX returns by season since 1970. Summers are red and winters are blue. The arrows show returns in the summer of over 10%.


What to expect in the month's ahead? Normally, a very good return.

Friday, October 18, 2013

Weekly Market Summary

Trend, Breadth, Volatility and Seasonality Are All Positives

10 days ago, the market's experienced a momentum kick-off. The indices, which have been traveling in 5-month channels, hit their bottom rail.  Put/call spiked to an extreme, indicating fear. This was followed by a plummet in volatility and the year's first 90% up volume day (chart). That combination of events has been a set-up for a new leg higher in the market in the past, and it appears to have been one this time as well (post).

Since then, SPX has been up 7 of the last 8 trading days.  On Friday, it closed back at the top of its channel.


How violent has this move been? Consider that at the low, SPX, NDX, RUT and 7 of 9 SPX sectors closed below their lower Bollinger band. Today, all of those closed above their upper Bollinger band for a second day in a row. That's an extreme swing.

What is particularly remarkable is the breadth of this rally. Today, the cumulative breadth of the NYSE exceeded its May high for the first time. Technicians regard this as confirmation of the uptrend (i.e., price and breadth agreement), as leadership is broad (chart). This is a positive, long-term development.

With the exception of utilities, all the SPX sectors are at or above prior highs (chart). The same is true for 3 of the 4 indices (Dow being the exception). Ex-US markets, especially Europe, are also breaking higher and confirming the US market (chart). All of this is also very positive for the long term.

So, to be clear, trend and breadth both appear strong. Add in low volatility and the start of the strongest 3-months of the stock calendar (November-January; also, 4Q up 83% of time after a strong September, here), and investors have a feel-good story.  Josh Brown summed it up well here.

Against this, we would continue to strongly caution against excessive bullish sentiment. Like the fund managers surveyed by BAML, a poll by Barron's finds bulls outnumbering bears by more than 8:1 (here).  In both surveys, fund managers are long growth/beta.

Wednesday, October 16, 2013

Fund Manager's Current Asset Allocation - October


Every month, we review the latest BAML survey of global fund managers. Among the various ways of measuring investor sentiment, this is one of the better ones as the results reflect how managers are positioned in various asset classes. These managers oversee a combined $700b in assets.

Overall, fund managers remain very bullish on risk (or, as BAML puts it, "steadfastly optimistic, undisturbed by events in DC"). In September, exposure to global equities was the second highest since the survey began in 2001, while exposure to fixed income was at the second lowest ever.


Friday, October 11, 2013

Weekly Market Summary

Coming into this week, SPX and the Dow were near the bottom of their long term (read: strong) channels, with a majority of sectors and ex-US indices holding up well and breadth signaling the market was oversold (post).  "Assume they (the channels) hold and these indices move higher."

By Wednesday's close, SPX, NDX, RUT and 7 of 9 SPX sectors were below their lower Bollinger. This is extreme, indicating that investors were selling indiscriminately (post). Moreover, put/call, which has been indicating complacency, jumped to a rare level of panic (first chart). And Vix spiked higher and made a double close below its upper Bollinger within a few days, a reliable bounce pattern in the past (post; second chart). Combined with the touch of the channel bottoms, these were reasons to expect the indices to change direction and move higher (post).


Thursday's action was remarkable. For the first time in 2013, breadth volume was more than 90% positive (post). In the past, this has often been a momentum kick off for the next leg higher in the market. Friday followed through.


The correction in SPX from the September top was 5%. That matches the correction in August and is shy of the 8% drop in June.

So, is that it for the correction? It might be.

Friday, October 4, 2013

Weekly Market Summary

Into the FOMC peak two weeks ago, SPX had risen 11 of the prior 12 days. Since then, it has fallen 9 of the past 12 days (post).

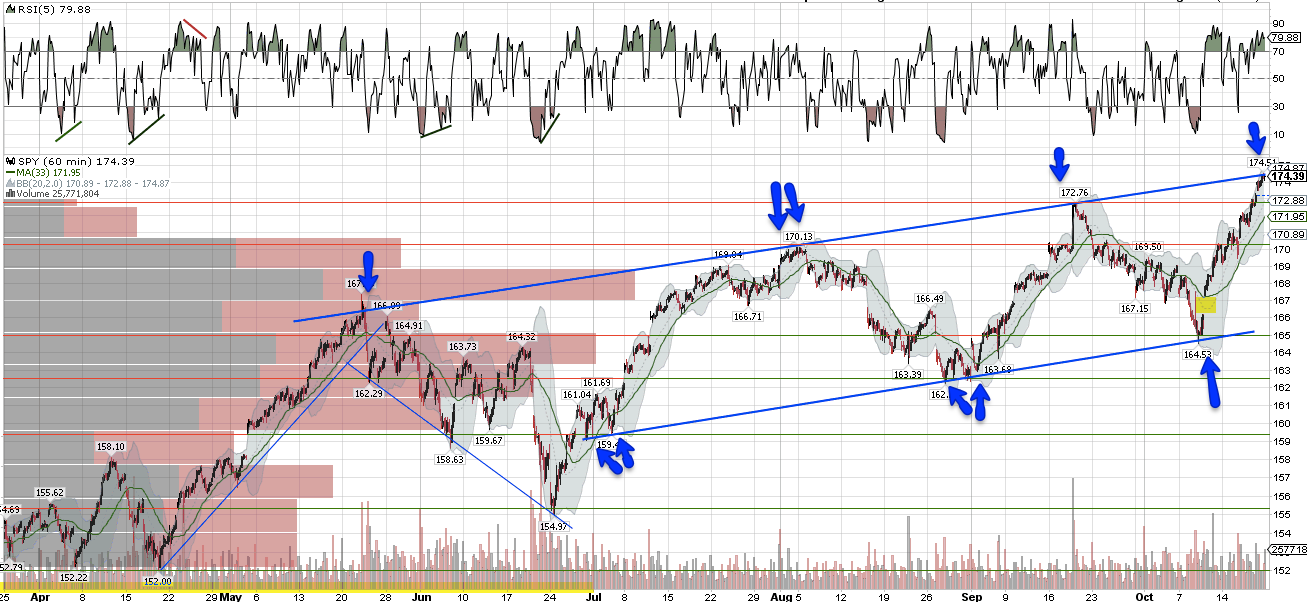
The selling has been concentrated in the large cap indices: SPX and the Dow. And here the good news is that all the selling has brought the SPX and the Dow to the bottom of their respective one-year and half-year channels (charts below). These long term support levels should be respected until broken. In other words, assume they hold and these indices move higher.


Moreover, SPX has just finished its 2nd down week in a row. It has not had a 3rd down week in a row since May 2012. Breadth supports at least a short term bounce (chart).

With the notable exception of financials, a majority of US cyclicals are holding up well (chart), as are ex-US markets (chart).

Macro and volatility continue to support longer term gains as well. In fact, the ratio of 1-month to 3-month volatility has spiked to a level where at least a short-term rally in SPX has typically taken place in the past (chart).

Finally, when SPX has a strong summer like this year (summers are normally weak; winters are when most market gains take place), the following 6 months are typically strong, gaining an average of nearly 10% (article).

Net, there are many reasons to expect SPX to finish 2013 strongly.

There's only one problem: nearly everyone has that view.

This week, Investors Intelligence reported the second lowest level of bears of 2013 (chart and chart). At the same time, AAII reported that individual investors increased their equity exposure to the second highest level of 2013 and reduced bond holdings to their lowest level in 4 years (post).

These data points are completely consistent with fund managers being extremely overweight equities (post), put/call being at a persistent low (chart) and short positions at record lows (article). Investors are not on the sidelines (chart).

In other words, everyone is expecting a big rally in stocks. The market is rarely so predictable.

What makes these asset allocation levels particularly noteworthy is that SPX is net flat since mid-May, four and half months ago. So investors have been getting unhedged long into a market that has gone nowhere. Who's buying? According the BAML, 'retail' investors are net buyers and institutions ('smart money') are net sellers (chart).

And when you are very bullish, as investors appear to be, what do you buy? High beta stocks, of course. Which makes it unsurprising that the RUT and NDX are outperforming by a wide margin (chart). The market is being driven by a chase for beta (post).

SPX is the best representation of US equities. The index accounts for more than 75% of total US market cap. In comparison, the RUT is just 9% (chart). The 6 largest components of the Dow are larger than the combined 2000 companies in the RUT. The weakness of large caps is not some sideshow. It's the main attraction, and the picture is one of faltering momentum (chart and post).

Assuming the debt-ceiling debate is resolved (it will be), the near term key to get momentum back into large caps is earnings growth (read a full post on this topic here). Earnings season starts this week. The consensus expects EPS (+3.2%) and sales (+2.6%) growth to pick up over 2Q, and for margins to expand. The bar is set even higher for the 4Q, with EPS growth of +10%. The next two quarters are essential for FY13 EPS to meet expectations of nearly 6% growth.

Expected to lead the growth are the financials (chart). Excluding them, EPS growth drops to a paltry +1.9%. It is noteworthy, therefore, that during 3Q, financial stocks significantly lagged the market (chart). Investors are apparently skeptical. The technical picture for financials, with its declining 50-dma, is bearish (chart).

It's also noteworthy that the consensus expects margins to expand yet, according to GS, they have already started to contract (chart). With revenue growth of just 2%, margin expansion is a must-have for EPS growth to meet expectations.

The rubber meets the road for corporate earnings starting this week.