A short holiday update.
Trend: The trend in US indices remains strong, following through on the strength that began last week. None of the indices or any of the 9 SPX sectors closed below even their 5-dma. This will be the first warning that weakness is afoot.
Friday, December 27, 2013
Friday, December 20, 2013
Weekly Market Summary
US markets end the week back in an uptrend, led, interestingly, by SPX and the Dow, with NDX and RUT lagging. A majority of sectors regained their rising 20-dma (short term) and 50-dma (long term) trend.
SPX is back above a rising 13-ema (yellow circles). With this week's new high, it fulfills the pattern we described two weeks ago - that 8 week streaks of higher closes do not end an uptrend, a higher closing high is high odds (post).
SPX is back above a rising 13-ema (yellow circles). With this week's new high, it fulfills the pattern we described two weeks ago - that 8 week streaks of higher closes do not end an uptrend, a higher closing high is high odds (post).
Tuesday, December 17, 2013
A Breadth Warning From NYSI and NYMO
2013 is the year breadth divergences appeared to be irrelevant. There have been seven major distribution days (90% down volume) and only one major accumulation day. The summation index declined from January until May without much impact on equities. And since May, the percentage of SPX stocks trading over their 200-dma has been in decline.
Today comes a new warning from the McClellan oscillators, NYSI and NYMO. NYMO measures the momentum in breadth and NYSI sums those values daily. A string of negative NYMO readings therefore causes NYSI to go negative. For more details, read here.
Aside from a few days, NYMO has been negative since October. As a result, Summation went negative at today's close.
Since 2000, NYSI (bottom panel) has been negative 20 separate times (yellow shading). Every time it has done so, SPX has not formed a durable bottom until NYMO (middle panel) has capitulated, meaning it closes at minus 75 or lower. The lowest close in NYMO so far has been minus 53. Today, it closed at minus 18.
Monday, December 16, 2013
Fund Managers' Current Asset Allocation - December
Every month, we review the latest BAML survey of global fund managers. Among the various ways of measuring investor sentiment, this is one of the better ones as the results reflect how managers are positioned in various asset classes. These managers oversee a combined $700b in assets.
Overall, fund managers remain very bullish on risk. In September, exposure to global equities was the second highest since the survey began in 2001; it is only marginally lower now. What is particularly remarkable is how long managers have been highly overweight equities (virtually all of 2013). This is longer than any period during the 2003-07 bull market.
Overall, fund managers remain very bullish on risk. In September, exposure to global equities was the second highest since the survey began in 2001; it is only marginally lower now. What is particularly remarkable is how long managers have been highly overweight equities (virtually all of 2013). This is longer than any period during the 2003-07 bull market.
Saturday, December 14, 2013
Weekly Market Summary
SPX has now gone 82 weeks without a 3-week losing streak. This is the second longest in the past 40 years. It's a relevant milestone, as SPX has now closed lower two weeks in a row. Will the streak end this coming week?
This week, SPY crossed above and then back below it's 13-ema (circles). This has been a pattern in 2013 (discussed last week) and it played out again this week. It came in conjunction with a second spike in the Vix Wednesday. The short term trend in SPY is down until the slope of the 13-ema reverses.
This week, SPY crossed above and then back below it's 13-ema (circles). This has been a pattern in 2013 (discussed last week) and it played out again this week. It came in conjunction with a second spike in the Vix Wednesday. The short term trend in SPY is down until the slope of the 13-ema reverses.
Friday, December 13, 2013
Is Wall Street Overly Bullish on 2014?
According to Business Insider, Wall Street consensus expects the SPX to rise another 10% in 2014, to 1950 (the mean as well as the median estimate). Read the article here.
Here are their YE 2014 forecasts (EPS in parentheses):
Barron's ran a similar survey this weekend. The consensus among ten strategists was a rise to SPX 1980 (+12%). See their picks here.
Is this realistic? The short answer is probably not.
Some background first.
Secular Bull Markets
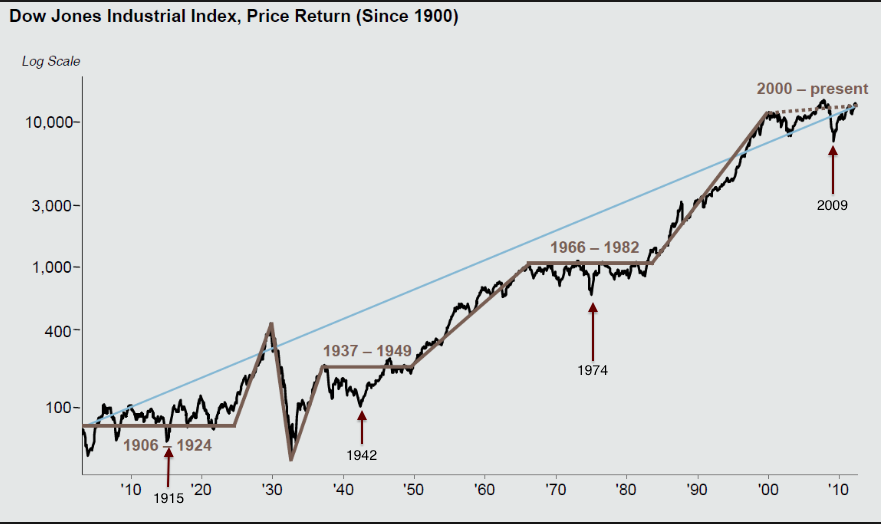
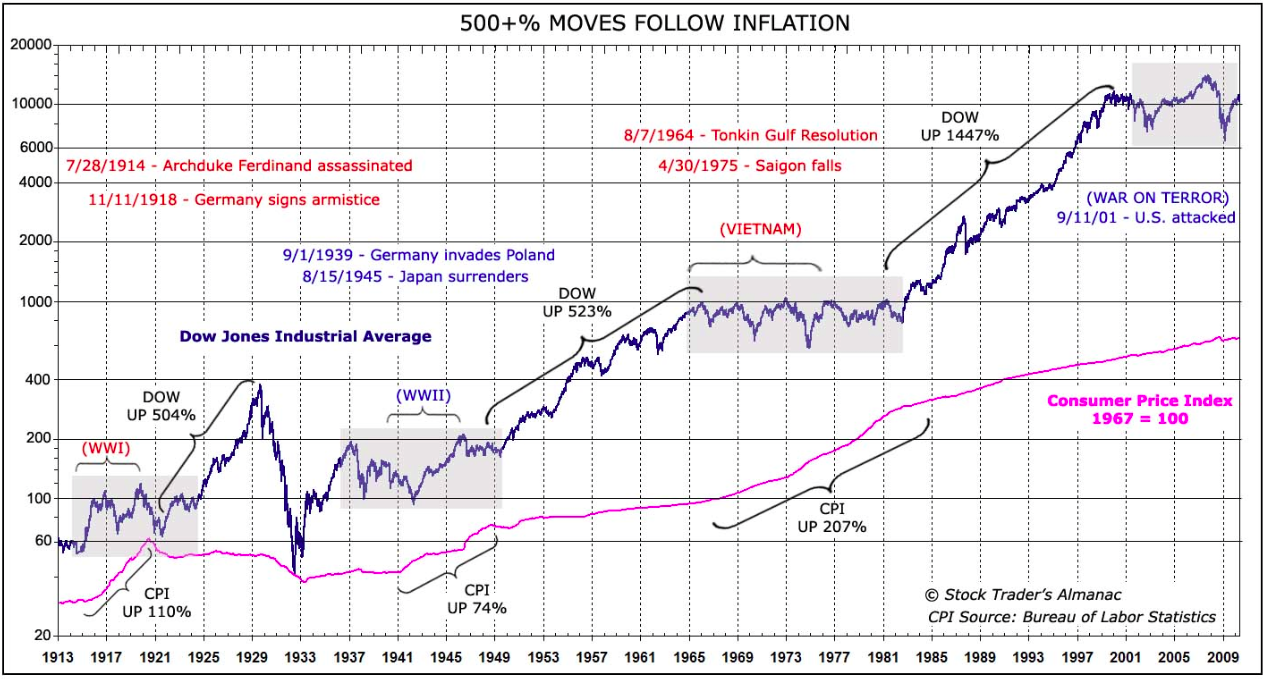
In the last 115 years, there have been three 'secular' bull markets. Secular bull markets are generational in length. The most recent ran 18 years, from 1982 until the 2000 tech bubble burst. The post-war bull market ran 17 years. The major lows were in 1915, 1942 and 1974.
Many believe that 2009 was also a generational low. It fits the pattern. If this is the case, there is a long secular bull market ahead. These have gained over 500%, so there is likely a lot of gains ahead.
Monday, December 2, 2013
A Volatility Set Up For Trading SPX Into Year End
Volatility as measured by Vix spiked higher today for the first time in two months. There is a useful trade set up that is therefore worth noting.
One of the least interesting but most useful indicators in 2013 has been volatility.
Throughout 2013, Vix has been telling investors to stay long. When Vix is under 20, average monthly returns in SPX are 1.5% and returns are positive 77% of the time. In comparison, when Vix is 25-30, average monthly returns in SPX fall to just 0.2% and returns are positive only 52% of the time. The higher the Vix, the worse the returns. Details are here (post).
There were two prior periods like today when Vix was consistently below 20. Both lasted 4 years and are notable for having infrequent and shallow (5%) corrections. Coincidentally, the prior periods were 1993-1997 and 2003-2007. Is this a 10 year cycle starting with years ending in '3'? Details are here (post).
A more frequently useful way to use Vix is to trade long equities when a volatility spike fades. Specifically, the set up is note when Vix has closed above its upper Bollinger Band and then to go long SPX after Vix has closed back below its Bollinger Band in the coming days.
We are noting this because today Vix closed above its upper Bollinger Band for the first time in almost two months.
Below are examples of this set up from 2012: the top panel is SPX, the middle panel is Vix and the bottom panel tracks closes above and below the upper Bollinger Band. The vertical green lines are signals to go long.
Subscribe to:
Posts (Atom)


