Friday, March 28, 2014

Weekly Market Summary

Expectations were for weakness post-Opex and during the last week of the month (post). In the event, RUT dropped more than 3%, NDX more than 2% and SPX more than 0.5% this week.

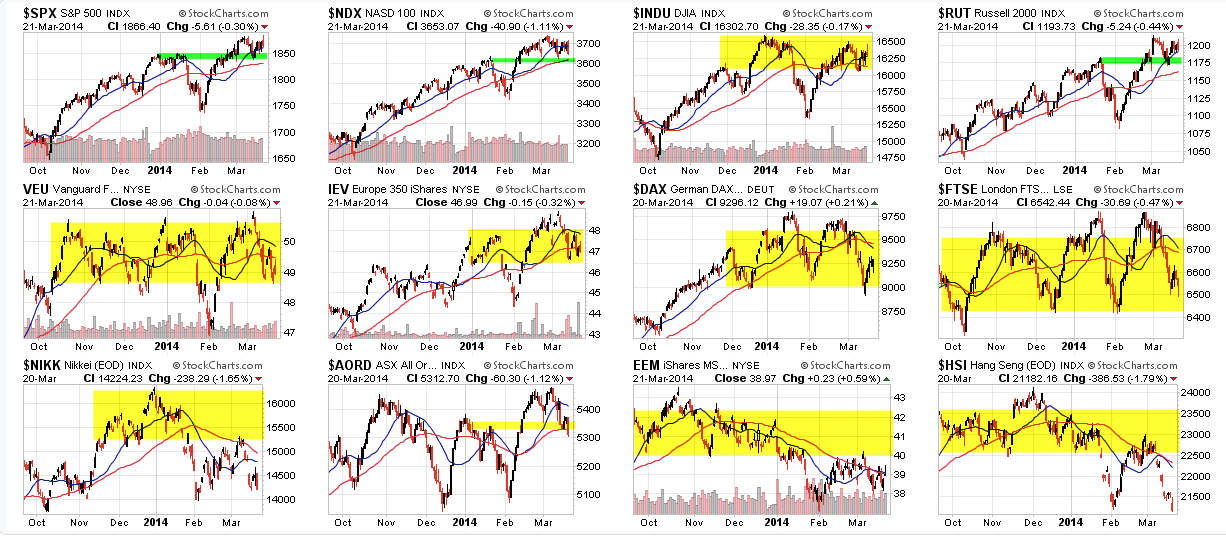
Equities made no progress in March. SPX was flat while RUT and NDX lost 3% or more. In comparison, treasuries, despite contrary comments by the Fed Chair, rose 1%. Given the torrid rise of equities in February, to say that March's lackluster performance was out of the consensus is a substantial understatement.

Entering 2014, analysts and pundits were expecting a repeat of 2013 (post). Things haven't turned out the way they expected.

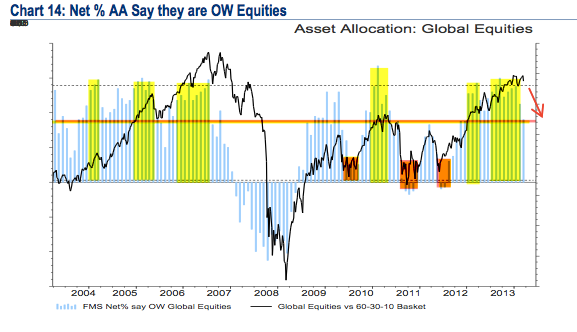
Investors have been massively underweight both commodities (far right, red) and fixed income (purple), both of which have massively outperformed; and they are overweight equities, especially technology (third bar) and small caps (fourth bar), which have declined.


Saturday, March 22, 2014

Weekly Market Summary

The recent story is this: two weeks ago, the US indices pushed to new highs, but the vicious bounce over the prior month had reached the point of exhaustion and a retrace was therefore due (post).

The following week, the indices declined, most ending last Friday right on their January pivot highs. There was an attractive set-up for a bounce into the current week (post). In the event, indices rose over 1%.

Which brings us to today. On Friday, SPX made a new all-time high in the morning. The other US indices were not far behind. Those gains were lost in the afternoon. Still, the trend in the US remains mostly positive.


Wednesday, March 19, 2014

Fund Managers' Current Asset Allocation - March

Every month, we review the latest BAML survey of global fund managers. Among the various ways of measuring investor sentiment, this is one of the better ones as the results reflect how managers are allocated in various asset classes. These managers oversee a combined $700b in assets.

What has been particularly remarkable is how long managers have been highly overweight equities (virtually all of 2013 and so far in 2014). This is longer than any period during the 2003-07 bull market (yellow shading). In September, exposure to global equities was the second highest since the survey began in 2001.


On the surface, equity exposure fell substantially in March, but this is misleading. Allocations to Europe, the US and EMs were virtually unchanged. The exception is Japan, where fund managers halved their substantial exposure to a 12-month low (Japan has recently been the second most overweighted market). This accounts for all of the month over month decline in equity allocations in March. 

Friday, March 14, 2014

Weekly Market Summary

Last week, trend remained bullish but there were a number of signs that the torrid pace over the prior month had reached the point of exhaustion. These studies indicated a month, or longer, of sideways/negative activity was likely to follow (read).

Thus, it was not a big surprise that US indices fell this week. For the most part, they are holding above the January highs, the Dow being the exception.

But ex-US markets have again become a mess, characterized by sideways choppiness over the past 6 months or longer. The Dax ended the week at a 4-month low; the FTSE and Nikkei are even worse.


Tuesday, March 11, 2014

How @Twitter Traded the Bull Market

On the 5 year anniversary of the generational low, we present a reminder of how @twitter traders navigated the bull market. #timestamp


Saturday, March 8, 2014

Weekly Market Summary

Short Term Outlook

The Russian situation caused SPY to drop hard on Monday and test its rising 13-ema for the first time in nearly a month. As discussed last week, this was a reliable buy signal (here and here).

The test held and SPX, NDX and RUT went on and to make new bull market highs this week. The laggard, DJIA, is now getting very close to also making a new bull market high.


Ex-US markets are gaining strength. The Euro Top 350 made a new high this week. EEM, the global laggard, is now above its 50-dma for the first time in 2014. All of this is positive.

Wednesday, March 5, 2014

Assessing Market Health Through Breadth

Breadth measures the number (or percentage) of stocks trending higher or lower. The conventional wisdom is that expanding breadth is bullish. Is this true? The short answer is no.

And what are breadth measures saying about the health of today's market? The short answer is to be cautious.

Let's start with NYSE advance-decline issues (NYAD) which measures advancing issues minus declining issues. It recently made new highs. The chart below looks at prior new highs in NYAD versus drops in NYSE of over 10%.