With an improvement in macro data in the past quarter, there is a concern that high interest rates are both imminent and a threat to equities. This should not be a concern.
The 10-year yield is currently 2.65%. A rise in yields from a low level like this has not, in the past, been a headwind for equity appreciation. The chart below shows a positive correlation between rising rates from a low level and equity appreciation (top left corner; chart from JPM).

Intuitively, that makes sense. Better growth is associated with higher equity prices and higher rates. It also improves valuations.
There's a similar concern that better data implies the end of QE in the autumn, and that this presents a threat to equities. The end of prior QE programs in 2010 and 2011 did, in fact, precipitate a fall in equity prices (next two charts from Bespoke).

The assumption at the time was that interest rates would rise when the Fed stopped their QE programs; instead, they fell. Why? Because easy money is stimulative and investors feared a slow down in growth. This led to a fall in rates and equity prices. If the market now anticipates better growth, rendering stimulative QE purchases superfluous, then ending those purchases should not precipitate a fall in prices.

Net, a small bump higher in rates and the end of Fed stimulus in themselves are not things with which to be concerned.
The caveat, and this is key, is that macro growth, and therefore SPX revenue growth, must now pick up. These are the things with which to be concerned.
More than 5 years into expansion, revenue growth is not driving earnings. It's been mostly margins. Margins have benefitted from low labor and interest costs. But history shows that sustainable earnings growth in prior bull markets, especially after several years into a recovery, are instead driven by revenues (light blue bars; next several charts from JPM).
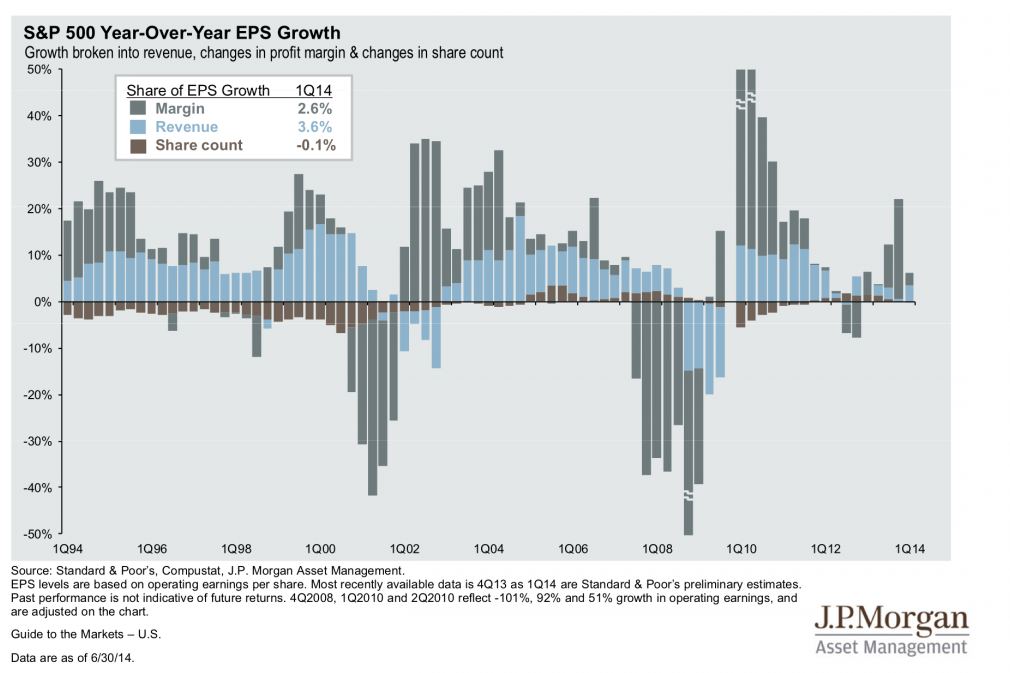
Revenue growth matters because total equity returns are still being driven not by earnings but by multiple expansion (dark bars, below). This is in contrast to the prior bull market.

In the first half of 2014, SPX rose 6%. If the consensus is right, EPS (TTM) rose 2.6% from the end of 2013. That means 57% of the year-to-date gains in SPX are from multiple expansion.
This follows the pattern of the last two years. In 2013, 80% of the gain in SPX was from multiple expansion. This pattern is beginning to resemble the final years of the tech bubble of the late 1990s. Asset prices are rising because someone else is an assumed buyer at a higher price, not because of underlying fundamentals.
Sales growth in 2013 was a paltry 2% but the consensus expects this to improve to 3% in 2014. We agree. But the current rate of appreciation in SPX (12% annualized) will be difficult to sustain when revenues are growing at just 3%.
This would not be an issue if multiples were lower, but price/sales for SPX is now 1.72 times, 8% above their peak in 2007 and more than 20% above their past 15-year median.
So the key remains growth. Did this week's employment data indicate faster than 3-4% nominal growth is imminent?
On its own, no. NFP rose by 288,000 in June. It was a great report. But monthly prints in NFP have always been volatile. Since 2004, every NFP print near 300,000 has been followed by one near 100,000.

For this reason, it is better to look at the trend; in June, trend growth was 1.8% yoy, up fractionally from 1.7% in May. Since the start of 2012, trend growth has been between 1.5% and 1.9%. In order to reach 3% growth, NFP will need to start printing 400,000 per month.

Likewise, despite expectations to the contrary, there remains little upward wage pressure. Average hourly earnings grew 2% yoy in June. In fact, this month's growth rate was the lowest since December. It's certainly not accelerating.

So, overall growth remains positive but modest. To be clear, there's reason for optimism, but none for exuberance. For an update on recent macro growth data, read further here.
Yet investors' expectations are high. Retail investors, as exemplified by the Rydex funds, have the lowest portion of their assets in cash accounts since 1998 (lower panel) and the lowest portion of their assets in "bearish" accounts since 2000 (second panel). They are clearly invested in the market (chart from Stockcharts).

Outside of the end of the tech bubble and one quarter in 1969, US households have now committed the highest portion of their financial assets to equities in the past 50 years (chart from Short Side of Long).

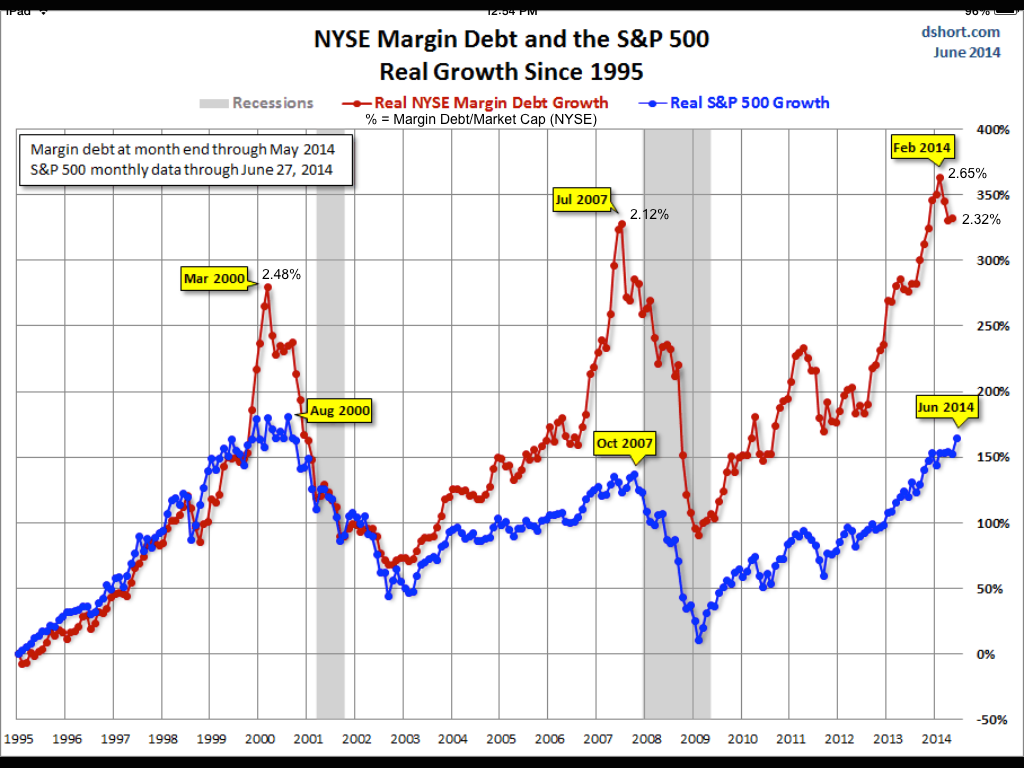
Lastly, the May margin debt data released this week showed investors remain highly leveraged. While margin debt is down 6% from its all time high in February, SPX is 3% higher.
This divergence has been significant in the past: SPX has dropped an average of 12% in the next 12-months the past 10 times margin debt has fallen this much while SPX has continued to rise. 80% of occurrences were lower in the next year (data from SentimenTrader; chart below from Doug Short).
The Week Ahead
Our expectation was for strength in equities in the week that just ended. Markets were not overbought and the pre-holiday period before 4th of July is typically strong. Moreover, NFP day has been positive 16 of the last 19 months (post).
Looking ahead, early July strength starts to fade in the middle of next week and remains soft the following 10 days. It is no longer a tailwind for equities.

Stating the obvious, the trend in equities is very strong. 5 of 9 SPX sectors closed the week at new highs, as did SPX and DJIA. Breadth is also strong, with more than 80% of stocks above their 50-dma and close to 90% above their 200-dma.
Nonetheless, following the seasonal pattern, we expect equities to trade sideways to lower in the next week. This is short term weakness within a strong uptrend.
The leader is NDX. It ended the week very overbought. RSI(5) has only been this high twice in the past two years, both of which were followed by lower prices in the next 1-2 weeks before the resumption of the uptrend. NDX is also up against a former trend line.

RUT ended the week at double resistance formed by the March pivot top and the former (broken) trend line. Note the loss of momentum in RSI.

DJIA ended the week at a new high. Momentum is gaining, not weakening. However, DJIA has a tendency to weaken after piercing its upper Bollinger as it did on Friday. It is also up against a trend line.

SPY formed a new high. All of its key moving averages are trending higher. It has reached a one-month channel top and there is a small divergence in RSI developing. Gap fill at 197.2 is first support (also the weekly pivot), followed by 196-196.5 (also the weekly S1). Major support is near 194 (also the weekly S2).

Treasuries weakened considerably this week, but held critical levels. The yield on both 10-year notes and 30-year bonds is below key resistance. Note RSI on both charts. For TLT, $110.5 is key support.


Our weekly summary table follows:
