Our key message has so far been that (a) growth is positive but modest, in the range of ~4% (nominal), and; (b) current growth is lower than in prior periods of economic expansion and a return to 1980s or 1990s style growth does not appear likely. This is germane to equity markets in that macro growth drives corporate revenue and profit expansion and valuation levels.
This post updates the story with the latest data from the past month. The overall message remains largely the same. Employment is growing at less than 2%, inflation is less than 2%, wages are growing at less than 2% and most measures of demand are growing at roughly 2% (real). None of these has seen a meaningful and sustained acceleration in the past 2 years.
We'll focus on four categories: labor market, inflation, end-demand and housing.
Employment and Wages
The July non-farm payroll (209,000 new employees) was in the middle of a 10-year range. This follows prints of 84,000 in December and 288,000 in June. Moving between extremes like these is nothing new: it has been a pattern during every bull market. Since 2004, every NFP print near or over 300,000 has been followed by one near or under 100,000 (circles).

This is not a recent phenomenon. The 1980s and 1990s bull markets were the same, only the range was higher. If anything, the swings in extremes were greater.
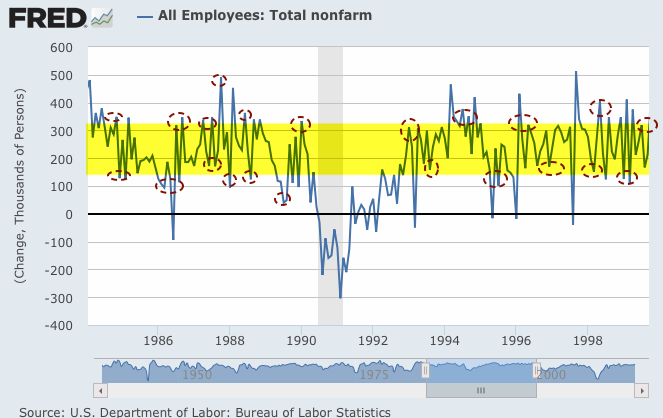
For this reason, it's better to look at the trend; in June, trend growth was 1.88% yoy, up fractionally from 1.84% in June. The trend in NFP employment has not much exceeded 2% growth yoy since 2000; the monthly prints shown above have been noise within a growth trend between 1.5% - 1.9% since the start of 2012. It wasn't much different in the 2003-07 bull market, so be careful assuming a trend with much higher growth than 2%. In order to reach the 3% growth of the 1990s, NFP will need to start printing 400,000 per month.

Released together with NFP is a report on average hourly earnings. In July, this showed growth of 2.0% yoy. Wage growth is not accelerating; 2% is the middle of its range since late 2009. In fact, last month's growth rate was the lowest since October 2012.

Similarly, the employment cost index shows modest growth in compensation. For 2Q14, it was 1.9% yoy. It is also not accelerating. In the last five quarters, yoy growth has been 1.9%, 1.9%, 2.0%, 1.7% and 1.9%.

Inflation
These employment and wage reports suggest only modest pressure from labor on inflation.
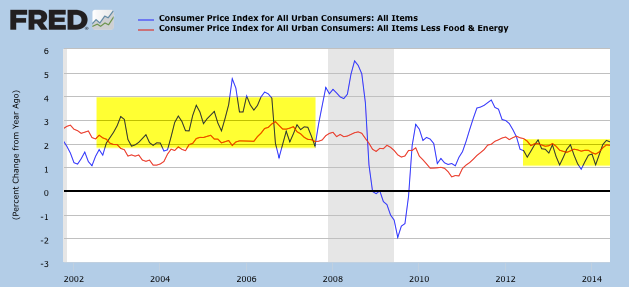
CPI and core CPI (excluding more volatile food and energy) are growing at 2.0% yoy. Neither has been much above 2% since 2Q 2012; each time it has approached 2%, like it did in the past three months, the rate has declined in the months ahead. In other words, there has been no sustained acceleration in inflation, yet. This is in contrast to 2003-07, when inflation was consistently closer to 3%. Consensus expectations are that inflation will now accelerate.
The Fed prefers to use personal consumption expenditures (PCE) to measure inflation; core and total PCE are now 1.5% and 1.6% yoy, respectively. Neither has been above 2% since 2Q 2012. Like CPI, there has been no sustained acceleration in inflation, and the rate is well below levels in 2003-07.

Demand
Next, let's look at several measures of demand growth. Regardless of which data is used, real demand has been growing at about 2.0-2.4%, equal to about ~4% nominal.
On an annual basis, real (inflation adjusted) GDP growth through 2Q14 was 2.4%, up from 1.9% in 1Q14 but down from 3.1% in 4Q13. 2Q growth was in the middle of the post-recession range (1.3-3.3%). It's positive, but lower than what the US is used to; prior expansionary periods since 1980 experienced growth of 2.5-4.5% yoy.

Stripping out the changes in GDP due to inventory gives you "real final sales". This is a better measure of consumption growth than total GDP. In 2Q14, this grew 2.0% yoy. In 1Q14, with the effects of winter, it was 1.8%. Aside from a bump higher in 4Q13, the trend in annual growth has been 2.0-2.3% every quarter the past 2 1/2 years (since 1Q12). In other words, the growth rate is not accelerating.

Similarly, the "real personal consumption expenditures" component of GDP (defined) grew at 2.3% yoy in 2Q14, in the middle of its range (2-3%) since 2Q 2010, but below the 3.0-4.5% that was common in prior expansionary periods after 1980.

Real retail sales grew 2.1% yoy in the past month. The range has been closer to 1.5-4% yoy for most of the past 20 years. There's been no persistent rebound after the purported effects of winter.

Core durable goods orders (excluding military, so that it measures consumption, and transportation, which is highly volatile) grew at 5.9% yoy (nominal) in June, a big improvement from the 0-3% growth seen in prior months so far in 2014. June's jump aside, this measure has been sluggish. During the heart of the prior bull market, growth was typically 5-12%. Current growth is similar to the period from mid 2006 through late 2007.

Industrial production is an important measure but it travels in a wide range. The typical range has been 1.5-4.5% yoy through the past 15 years; in the last two months it has been near the high end at 4.3%. During much of the 1990s, the range was much higher: 3.5-7%. Excluding mining and oil/gas extraction, the manufacturing component of industrial production is growing at 3.6% yoy, a slight decline in growth from May.

Housing
Finally, let's look at two measures of housing. After a weak winter, housing data has not had a sustained improvement. Like other data, growth is positive, but tepid.
First, new houses sold declined 6% yoy in April and then rebounded with 17% growth in May. In June, it fell again, this time by 12% yoy. The widely expected recovery from winter weakness has been mild. Overall, the level of sales is still meager relative to prior bull markets. A more sustained pick up from winter remains the key watch out.

Second, after a decline in winter, housing starts is back to growth, but it is lumpy. Growth was 7% yoy in June, down from 9% growth in May and 26% in April. This followed a 4% yoy decline in March. The overall level of construction is well off those during the prior two bull markets, but the trend is modestly positive.

Summary
In summary, the major macro data so far suggest positive, but modest, growth. This is consistent with corporate sales growth. SPX sales growth the past 3 years has been positive but has only averaged 2-3% (nominal) per annum. That's the trend, although there is considerable variation around trend each quarter. This variation is usually noise; the low growth of 1Q14 and the high growth of 4Q14 are recent examples.
The consensus expects growth to accelerate to 3-4% (nominal) in 2014; we agree.

With valuations at high levels, the current pace of sales growth is likely to be the limiting factor for equity appreciation. This is important, as the consensus expects earnings to grow at 8% in 2014 and 12% in 2015.
Modest growth should not be a surprise. This is the classic pattern in the years following a financial crisis like the one experienced in 2008-09. It is also what the flattening spread in yields have been signaling for all of 2014.

If there is a bright spot, it's that macro expectations usually improve in the second half of the year; it has already started to improve and this will likely carry into 2H14. That doesn't mean growth above 3-4%, but data that meets or exceeds lowered expectations.
