This was an incredibly quick fall and recovery to a new high. Recall that in July, fund managers had their second highest equity overweight since 2001. After every similar situation, SPX typically fell 8% over 4 weeks and then took another 6 weeks to regain all of its losses. This time: a 4% fall in 10 days with a full recovery 10 days later.

This type of strength, as we have seen before, is usually followed by further gains. Two studies follow that demonstrate this tendency well.
First, Quantifiable Edges notes that SPX has now gone from a 50-day low to a 50-day high in only 10 days. How rare is this? Since 1950, it has happened only 6 times previously. Importantly, all 6 were higher 3 weeks later and the average gain (5%) was 5 times the average loss.

A second study, by Dana Lyons, comes to the same conclusion by different means. There have been 8 "v-shaped bottoms" in the past 18 months. Once SPX has returned to its previous peak (like now), downside was 1% versus an average gain of 4%. Like the first study, risk/reward is skewed strongly positive. And like the first study, price continued to run higher 3 weeks later.

The more mundane studies we shared last week reach a similar conclusion (post). First, all 4 US indices have positive crosses in their MACDs and newly rising 13-emas, a combination which has been a reliable set up for multi-month rallies.
Second, once SPX has then also closed above its 50-dma, it has usually advanced quickly higher, as we saw this week. On weakness, the 50-dma is normally support (arrows). Importantly, the prior low is usually not violated.

And third, SPY has now closed above its rising 5-dma 11 days in a row. That type of strength does not normally mark the end of an uptrend; there's usually a higher high after the first close below the 5-dma. The trend is due for a pause, however.

So there are good reasons to expect the next several weeks to be positive. But there are some caveats heading into next month to consider. Sorry, Mr Market doesn't provide a narrative without a few risks.
First, the weakest rallies in the MACD/50-dma set up shown above have occurred during the summer months, and this is a watch out now. The June 2013 rally lasted a month and the September 2013 rally lasted just 3 weeks. Of course, 2010, 2011 and 2012 all saw substantial summer weakness. Even in the context of the ongoing 5 year bull market, the recent pullback would be an exceptionally shallow low with which to punctuate the weakest 6 months of the year.

Second, September is typically a bomb. It is the weakest month of the year over every time frame. For reasons discussed next, September may be an especially vulnerable period this year (chart from Bespoke).

Third, both SPX and NDX have been trading above their respective 200-dmas for more than 400 days. This is a 3-sigma event. That means the probability of them occurring is less than 0.27%. SPX has rallied above its weekly Bollinger band for 20 months; it will be 21 months in another week. This is 3 months longer than the gold standard set in 1995-96. And the amount SPX has rallied is also similar: about 50% during both periods.

Overwhelmingly, these lower Bollinger band touches occur in the summer months (blue arrows). The only exceptions have been 1995 and 2013 (orange). In 1996, the streak ended in July. A second year without a lower Bollinger band touch during the summer would be exceptional even for this bull market.

So SPX is likely to advance further, but perhaps not by much and not for long. To the downside, at present, the lower Bollinger for SPX is near 1830, 8% below the recent highs. The most obvious catalyst for trouble is Europe: the Euro 350, the German DAX and the French CAC are all below their 200-dma. Those 200-dma's are very close to sloping down.

The Week Ahead
The studies presented at the top of this post strongly suggest upside over the next weeks. Certainly, the trend in SPX, NDX and DJIA is higher.
We think the rally cools off next week, at least for the first few days, before resuming.
Yesterday, we posted two studies suggesting weakness near term (read it here). First, Trin closed at 0.5 on Wednesday. The last 12 times this has happened, SPX has moved lower in the days ahead every time except one.

Second, the hourly RSI for SPY closed over 95. That too has been a signal for SPY to weaken before moving higher.

SPY's rapid, uninterupted advance has also formed a wedge. It's likely to break. The 198 area should be strong initial support (yellow), formed by the July trading range. Weekly S1 and Tuesday's gap fill are both near 197.3, with the 13-ema near 197.

NDX is the strongest index. The daily RSI is now 89. Prior times are shown below with a blue line; price has tended to consolidate or weaken to the rising 13-ema in the following days. That should be solid first support (arrows), especially as it now aligns with the late July top (3990 area). Note that the index is up against a trend line formed by connecting tops in March and July.

RUT is the weakest index and its at a critical juncture. Despite the rally, it remains below the key 1160 level (arrows) and its 200-dma. RUT spent the week trying to break higher. This is probably a consolidation before a pop higher. That would be a very good omen for the other indices.

Finally, we have mentioned commodities (the CRB index, grains and oil) recently. They have failed to rally so far and sentiment is reaching a significant low. The chart below from Chris Kimble summarizes the set up well.

Of special note is that commodities correlate with emerging markets (who both produce and consume). EEM (black) has recently moved up without commodities (blue). It frequently moves first (arrows).

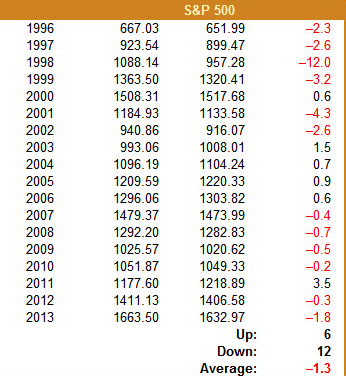
The end of August is usually weak (chart is from Sentimentrader).

The last 5 days have been net down in 6 of the last 7 years (columns show, in order, open, close and 5 day net change in percent; from Stock Almanac).
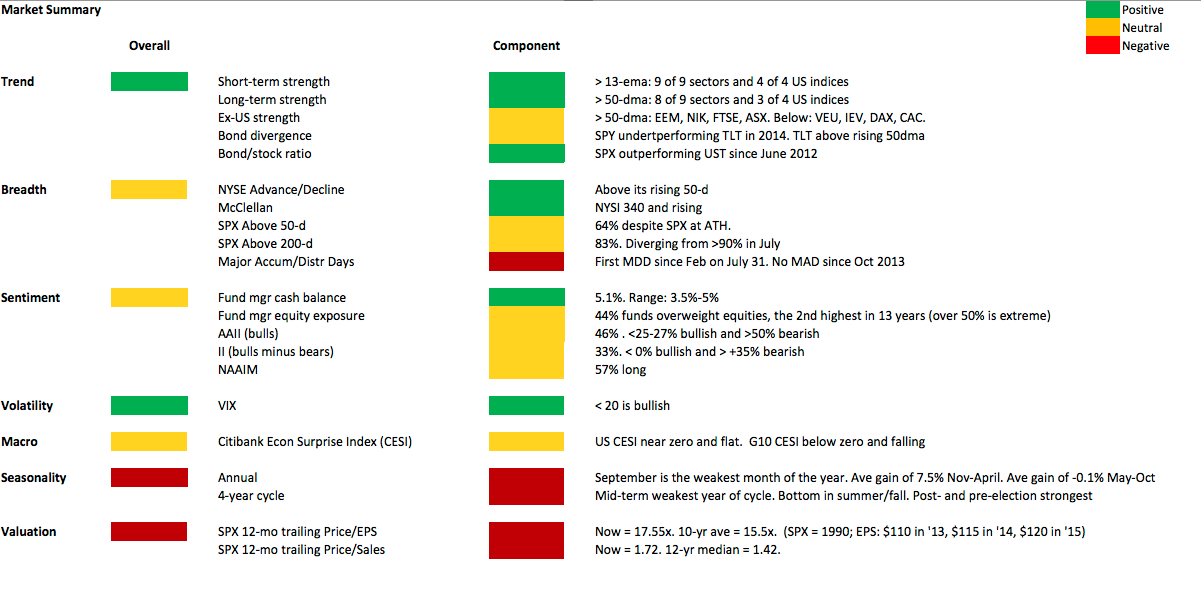
Our weekly summary table follows.