It would be unusual if SPX dropped right through its 200-dma by more than ~2% without first bouncing higher. Unusual, but not impossible. In October 1987, after spending 10 months above its 200-dma, SPX closed right on it. Two days later, the index lost 30%.
In the past 5 years, SPX has had four similar "first touches" of its 200-dma (arrows). Each time, the index moved higher without losing more than ~2% first. The likelihood of this happening here, given the length of the rally, would seem to be very good.

The same was true during the 2003-07 bull market. Note that in both of these charts, a quick return to the 200-dma after an initial bounce raises the risk of a fall lower.

Going back to the latter half of the 1990s bull market, we get the same conclusion. This seems to be a reliable pattern with a favorable risk/reward.

RUT presented the same set up in mid-April. After touching its 200-dma, it moved 3.5% higher in the next week. It undercut the first low at the end of April and then struggled for the next month. That would be our expectation here as well should the initial bounce reverse back to the 200-dma.

Recall that SPX had gone 23 months since touching its lower weekly Bollinger Band. That streak ended on Friday as well. Not surprisingly, the set up is similar to those shown above for the 200-dma. Even in the weakest case, SPX move back to the middle of its Bollinger; that is currently near 1965, about 3.5% higher. This is likely to be an important point of reference should SPX bounce in the coming weeks.

Adding some confidence to the 1900 level in SPX is that it has also been a prior area of support/resistance. Note the divergence in RSI. However, the 13-ema is still declining, and the 50-dma has started to decline, meaning both the short and intermediate trend is negative. This suggests any bounce is counter trend.

We would put the probability of a repeat of a 1987-type event as very low. However, as we have said before, sentiment is eerily similar. These are the only two periods in the past 30 years where investment advisors have been so stubbornly bullish (red shading is where Investors Intelligence bull:bear ratio over 3).

What is concerning is that large cap US stocks have been falling for 3 weeks, small cap stocks for 3 months and the Dow is now negative for 2014, yet investors are not bearish. The II bull:bear ratio increased this week; it remains highly elevated. So did the percentage of AAII bulls (although the signal is neutral). We would have expected these to show increasing signs of worry. They haven't.
To take one additional example, investors in Rydex funds have about 2.5 times greater assets in bullish funds relative to bearish funds. That would have been an excessively bullish allocation in 1999 or any other time prior to 2013. Since then, it has been close to a low (like in February 2014).

The sentiment picture is not uniformly negative, however. The Daily Sentiment Index (DSI) for SPX this week hit lows similar to early August 2011, May 2012 and November 2012. In all 3 cases, equities bounced higher; in the first two instances, they then moved lower (chart from Chad Gassaway).

We have been discussing the dichotomy between the pre- and post-2013 periods in recent weeks. Relative to the past two years, US equities would now seem to be near a washout, but relative to any period prior to 2013, a deeper washout marked lows. In the Rydex chart above, compare the current allocation relative to even June 2012 let alone lows in 2004, 2005 and 2006.
Momentum indicators, like RSI and MACD, are similar. These have been elevated for two years. At prior lows, for example, the weekly MACD (lower panel) has been near zero or negative; today, it is still well above zero.
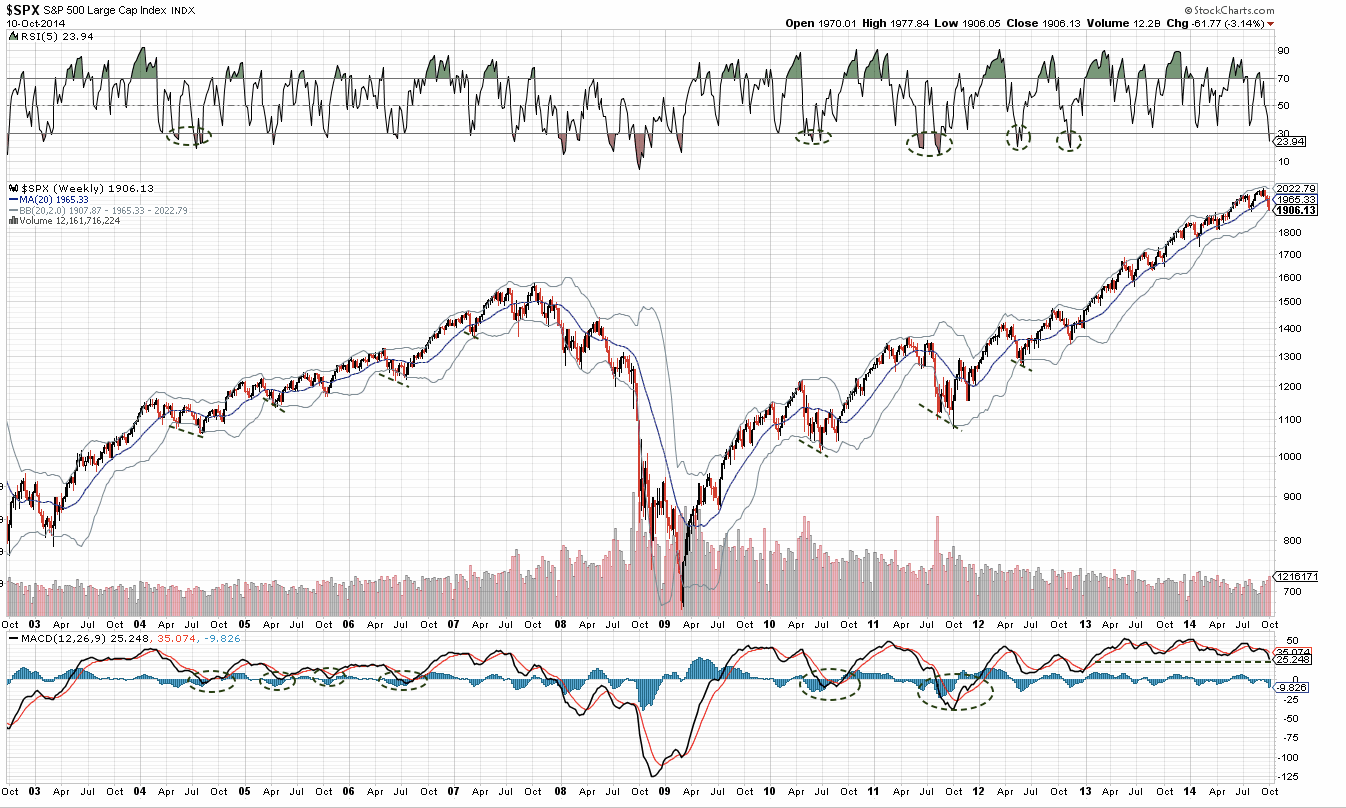
Likewise, breadth is washed out relative to, for example, February 2014, but not relative to any period prior to 2013 (circles). The lowest panel measures the percentage of SPX stocks above their 200-ema; its now 49%. Near 40% would probably be a solid low, something to watch for in the weeks ahead.

So how do we reconcile these differences? There are two possible scenarios.
The first scenario is that the 2013 playbook is still operative; equities are sufficiently washed out to form a durable low within about 2% of 1900. The short, 5% correction is nearly over and equities will soon resume their uptrend to new highs.
The second scenario is that the pre-2013 playbook is back; equities are short term oversold, sufficient to bounce, but longer term measures need more time to wash out, and so a second wave lower is likely after the initial bounce is over.
Underestimating this bull market has been a mistake. It might be again here. But the four sources of excess liquidity that have likely turbo charged equities recently - Fed POMO flows, corporate buybacks, investor leverage and investor equity allocations - are either waning or near prior peaks (a full post on this is here). That would seem to tip the scales in favor of the second scenario.
Ideally, under the second scenario, SPX moves higher next week to backtest its 50-dma (1970) or the 2000 level. Call this the B wave; the A wave was the decline from the September high at 2019. It then moves below Friday's low over the following several weeks (the C wave). The measured move targets 1800-1850. You can read an excellent post from Tony Caldaro on this here.
The poor performance of RUT in the US is not an outlier. Aside from SPX and NDX, equities around the world are trading negative in 2014 and more than 10% off their recent highs. The outliers are SPX and NDX.

The leader, NDX, was one of the worst performers this week, losing nearly 4%. However, it's now less than 1% from a prior level of support. Price is as stretched from its 13-ema as it was in April this year. It's 200-dma is about 3% lower.

RUT had regained its critical 1080 level a week ago. Another break, we said, and the index would likely initiate a move 10% lower. This triggered on Monday. 1040 and then 1000 are the next support levels to watch for a positive reaction.

The coming week is Options Expiration. October is seasonally weak, but October has had the second strongest OpX week performance in the past 30 years. The only stronger OpX month is December. SPX has been higher 73% of the time during October OpX.
Our weekly summary table follows.

If you find this post to be valuable, consider visiting a few of our sponsors who have offers that might be relevant to you.