At the time, the consensus view was that growth in wages and employment were accelerating and that this would soon lead to a meaningful increase in inflation above the Fed's 2% target. Our monthly review of the data has consistently shown this view to be wrong.
This post updates the story with the latest data from the past month. We are now starting to see better growth. Highlights:
- Real final sales growth of 2.8% was the highest in 8 years
- Industrial production growth of 5.2% was the highest in 4 years and, coming six years into the recovery, was arguably the most impressive report since 2000.
- Employment growth in 2014 was the highest since the year 2000. Moreover, the 3Q14 employment cost index was the highest since the recession.
- However, the inflation rate continues to decelerate. It's well below the Fed's target of 2% yoy.
With the latest data, our overall message remains largely the same. Employment is growing at ~2%, inflation and wages are growing at ~2% and most measures of demand are growing at ~2.5-3% (real). The economy is continuing to slowly repair after a major-financial crisis.
We'll focus on four categories: labor market, inflation, end-demand and housing.
Employment and Wages
The December non-farm payroll (253,000 new employees) followed the incredible 353,000 in November, the highest since January 2012.
In the past 12 months, the average gain in employment was 211,000, the highest since the year 2000.

Monthly NFP prints are volatile. Since 2004, NFP prints near 300,000 have been followed by ones near or under 200,000 (circles). Moving between extremes like these is nothing new: it has been a pattern during every bull market. What is becoming remarkable, therefore, is that NFP has been above 200,000 every month since January 2014.

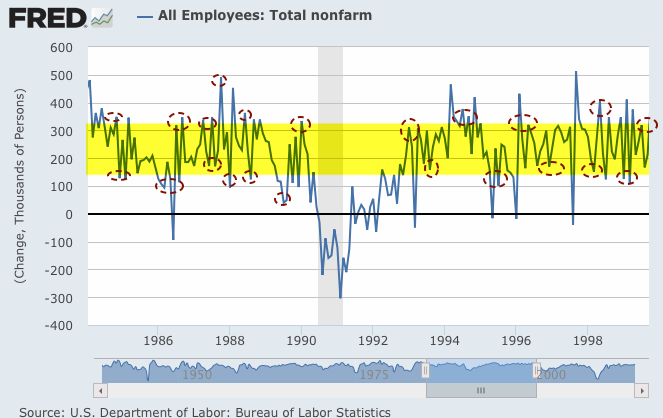
For this reason, it's better to look at the trend; in December, trend growth was 2.15% yoy, the highest since March 2006. The trend in NFP employment has not much exceeded 2% growth yoy since 2000; the monthly prints shown above have been noise within a growth trend between 1.5% - 2.0% since the start of 2012. It wasn't much different in the 2003-07 bull market. In order to reach the 3% growth of the 1990s, NFP will need to consistently average over 260,000 per month.


The employment cost index shows modest growth in compensation, with a caveat. For 3Q14, it was 2.2% yoy. In the last six quarters, yoy growth has been 1.9%, 1.9%, 2.0%, 1.7%, 1.9% and 2.2%. The latest print is the highest since the recession; this is good news, but prior pops higher have not been sustained. It's too early to say the trend has improved, but this is a possible light at the end of the tunnel.

Inflation
These employment and wage reports suggest only modest pressure from labor on inflation. In the event, inflation has been decelerating in recent months and remains well below 2%.
CPI and core CPI (excluding more volatile food and energy) are growing at 1.3-1.7% yoy, respectively. The more important core CPI was the lowest since March. Neither has been much above 2% since 2Q 2012; each time it has approached 2%, the rate has declined in the months ahead. In other words, there has been no sustained acceleration in inflation. This is in contrast to 2003-07, when inflation was consistently closer to 3%. Consensus expectations are that inflation will accelerate but it hasn't happened.

The Fed prefers to use personal consumption expenditures (PCE) to measure inflation; core and total PCE were 1.2% and 1.4% yoy, respectively, in November . Neither has been above 2% since 2Q 2012. Like CPI, there has been no sustained acceleration in inflation, and the rate is well below levels in 2003-07.

For some reason, many mistrust CPI and PCE. MIT publishes an independent price index (called the billion prices index). It tracks both CPI and PCE very closely.

Demand
Next, let's look at several measures of demand growth. Regardless of which data is used, real demand has been growing at about 2-3%, equal to about ~4% nominal.
On an annual basis, real (inflation adjusted) GDP growth through 3Q14 was 2.7%. 3Q growth was slightly above the middle of the post-recession range (1.3-3.3%). It's positive, but lower than what the US is used to; prior expansionary periods since 1980 experienced growth of 2.5-5% yoy.

Stripping out the changes in GDP due to inventory gives you "real final sales". This is a better measure of consumption growth than total GDP. In 3Q14, this grew 2.8% yoy, the highest since 4Q 2006. A sustained break above 2.5% would be noteworthy.

Similarly, the "real personal consumption expenditures" component of GDP (defined), the component which accounts for about 70% of GDP, grew at 2.7% yoy in 3Q14, at the high end of its range (2-3%) since 2Q 2010, but below the 3-5% that was common in prior expansionary periods after 1980.

On a monthly basis, the growth in real personal consumption expenditures remains in a 2-3% annual growth range: in November, growth was 2.8% yoy. This was the third highest rate of growth in 4 years.

Real retail sales grew 3.8% yoy in the past month. The range has been 1.5-4% yoy for most of the past 20 years. The latest print is the highest since June 2013.

Core durable goods orders (excluding military, so that it measures consumption, and transportation, which is highly volatile) grew at 3% yoy (nominal) in November. This follows four strong months of 8-9% yoy growth from June through September. During the heart of the prior bull market, growth was typically 7-13%.

The typical range for annual growth in Industrial Production has been 1.5-5% through the past 15 years. In November, it was 5.2%, the highest rate of growth since January 2011. Coming nearly six years into the recovery, this was arguably the best industrial production report since 2000. During much of the 1990s, the range was much higher: 3.5-7%. Excluding mining and oil/gas extraction, the manufacturing component of industrial production is growing at 5.1% yoy.

Housing
Finally, let's look at two measures of housing. After a weak winter, housing data has improved. Like other data, growth is positive, but tepid relative to prior bull markets.
First, new houses sold was 438,000 in November; it's virtually unchanged from January 2013. The overall level of sales is still meager relative to prior bull markets. 30 years ago, 600,000 would have been at the low end of the range for monthly sales. The widely expected recovery from winter weakness has been modest.

Second, after a decline in winter, growth in housing starts is positive but volatile and the latest starts are below those of December 2012, almost two years ago. Still, overall starts were the 5th highest in the past 6 years. The overall level of construction is well off those during the prior two bull markets, but the trend is positive.

The growth in housing starts had looked like it was being driven by multi-unit housing (red line), but that growth appears to be tapering off; meanwhile, single family housing starts in October were the highest since the recession and November was just a bit lower (blue line).

Summary
In summary, the major macro data so far suggest positive, but modest, growth. This is consistent with corporate sales growth. SPX sales growth the past year has been positive but only 3.6% (nominal).
The consensus expects sales growth to accelerate slightly to 4% (nominal) in 2014; the macro data presented here makes this seem reasonable.

With valuations at high levels, the current pace of sales growth is likely to be the limiting factor for equity appreciation. This is important, as the consensus expects earnings to grow at 10% in 2015.
Modest growth should not be a surprise. This is the classic pattern in the years following a financial crisis like the one experienced in 2008-09. It is also what the flattening spread in yields have been signaling for all of 2014 and now into 2015.


If you find this post to be valuable, consider visiting a few of our sponsors who have offers that might be relevant to you.