Remarkably, allocations to cash are now even higher than in February, and allocations to equities dropped to a new 4-year low. Fund managers have pushed into bonds, with income allocations rising to a 3 1/2 year high in June. Overall, fund managers' defensive positioning supports higher equity prices in the month(s) ahead.
Allocations to US equities remain near their 8-year lows, a level from which the US should continue to outperform, as it has during the past year. Europe remains overweight. Emerging market allocations have jumped significantly in the past five months and are now the most overweight since September 2014, a high from which emerging market indices fell over the next half year.
* * *
Among the various ways of measuring investor sentiment, the BAML survey of global fund managers is one of the better as the results reflect how managers are allocated in various asset classes. These managers oversee a combined $600b in assets.
The data should be viewed mostly from a contrarian perspective; that is, when equities fall in price, allocations to cash go higher and allocations to equities go lower as investors become bearish, setting up a buy signal. When prices rise, the opposite occurs, setting up a sell signal. We did a recap of this pattern in December 2014 (post).
Let's review the highlights from the past month.
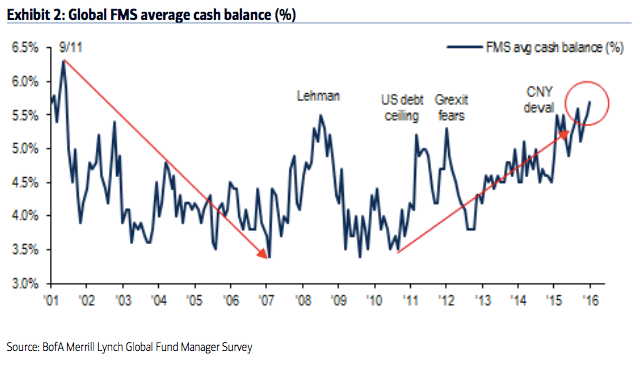
Cash: Fund managers cash levels at the equity low in February were 5.6%, the highest since the post-9/11 panic in November 2001, and lower than at any time during the 2008-09 bear market. This was an extreme that has normally been very bullish for equities. Remarkably, with the SPX having since risen 17%, cash in June is now even higher (5.7%) and at the highest level in 14 years (since November 2001). Even November 2001, which wasn't a bear market low, saw equities rise nearly 10% in the following 2 months. This is supportive of further gains in equities.
Global equities: Fund managers were just +5% overweight equities at their low in February; since 2009, allocations had only been lower in mid-2011 and mid-2012, periods which were notable lows for equity prices during this bull market. Despite the rally since February, allocations are now even lower, dropping to +1% overweight in June. This is 1.1 standard deviations below the mean.

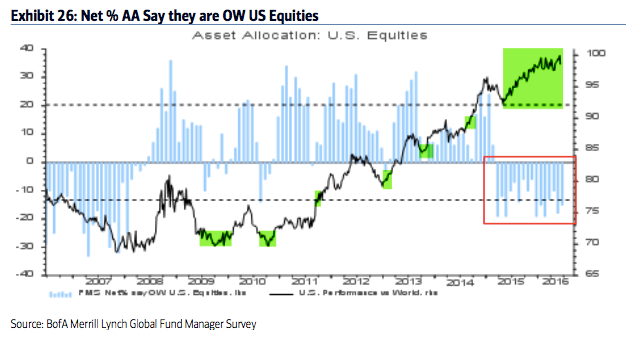
US equities: US exposure is still near an 8 year low (-15% underweight; it was -19% underweight in February). Despite low exposure, US equities have outperformed during the past year. US equities have been under-owned and should continue to outperform other regions on a relative basis (see below).
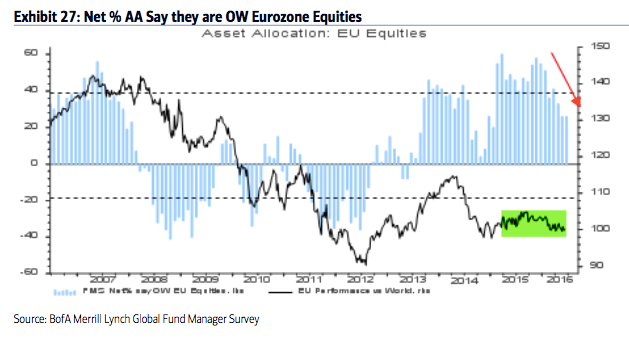
European equities: Eurozone exposure has been falling but is flat m-o-m at +26% overweight. Exposure has become less extreme (0.4 standard deviations above the long term mean) but relative to the US, European equities are at risk of continued underperformance.
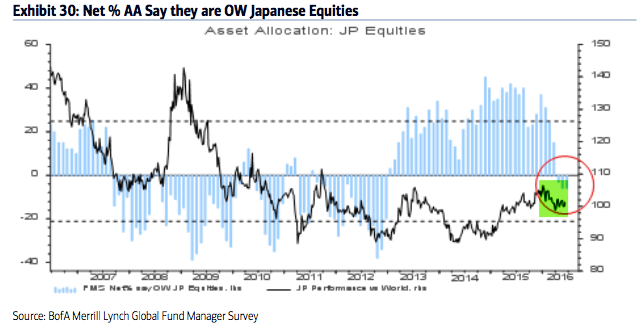
Japanese equities: Allocations to Japan have been falling but are flat m-o-m at -6% underweight, which is the lowest since December 2012. The region has been underperforming in 2016.
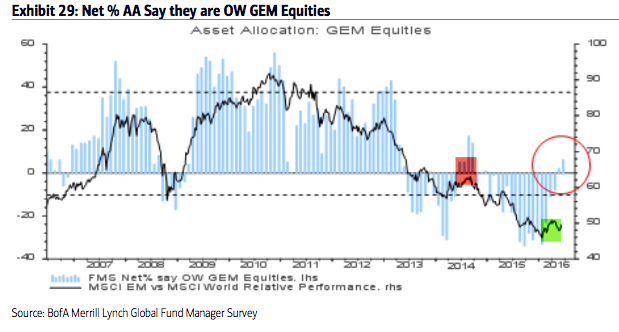
Emerging markets equities: In January, allocations to emerging markets fell to the second lowest in the survey's history (-33% underweight), an extreme comparable only to early-2014 from which the region began to strongly outperform for the next half a year. Allocations have since risen to +6% overweight, the highest in 21 months, which is still 0.5 standard deviations below the long term mean. The region has outperformed the rest of the world so far 2016. Allocations are now back to where the rally in mid-2014 failed.
Global bonds: Fund managers are -34% underweight bonds, a 3.5 year high allocation. This is a big rise from -64% underweight in December (a 2-year low allocation). Bonds outperformed in the 10 months before the current equity rally began in February. Note that bonds have historically started to underperform when allocations rise to -20% underweight (red shading). Current allocations are back to their long term mean.

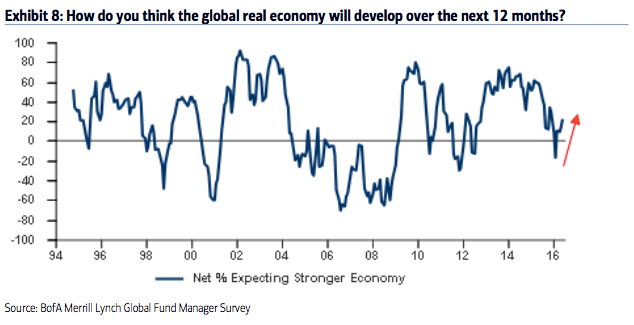
In February, 16% of fund managers expected a weaker economy in the next 12 months, the lowest since December 2011. Investors are still pessimistic, with only 23% expecting a stronger economy in the next year. This explains the low allocations to equities and high allocations to cash.
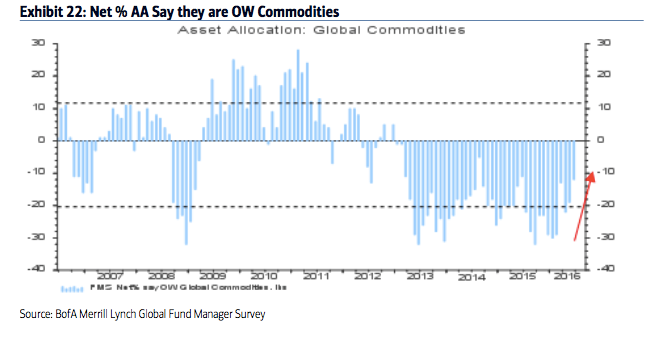
Commodities: Allocations to commodities improved to a 12-month high at -12% underweight. This is just 0.5 standard deviations below the long term mean. In comparison, in February, allocations were near one of the lowest levels in the survey's history (-29% underweight). The improvement in commodity allocations goes together with that for emerging markets.
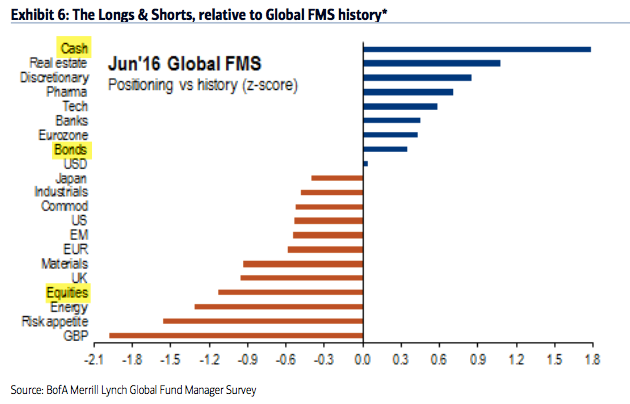
Sectors: Relative to history, managers are extremely overweight cash. They are more overweight bonds than equities. Overall, this is very defensive positioning.
In May, fund managers believed 'growth' stocks would underperform 'value' stocks over the next year. This reflects a pessimistic view on earnings, the economy and therefore higher beta stocks. This was also the case, for example, in early 2009.

Relative to bonds, commodities and cash, allocations to equities remains near the lows formed in mid-2010, 2011 and 2012. This is supportive of further gains in equities.

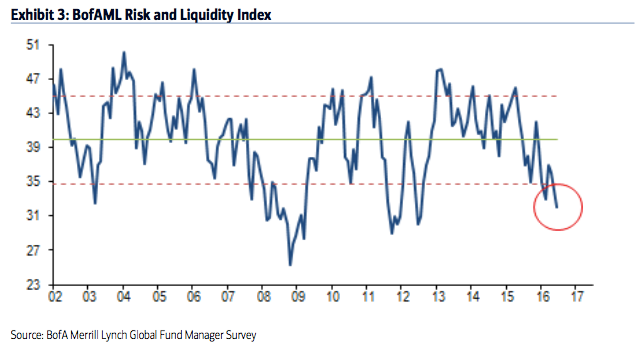
Fund managers 'risk appetite' (a function of their equity sector allocation, cash levels and time horizon) is 1.6 standard deviations below the mean, at a 4 year low and below the low levels from February.
Survey details are below.
- Cash (5.7%): Cash balances increased to 5.7% from 5.5%. This is higher than in February (5.6%) and the hight since November 2001. Typical range is 3.5-5%. BAML has a 4.5% contrarian buy level but we consider over 5% to be a better signal. More on this indicator here.
- Equities (+1%): A net +1% are overweight global equities, down from +6% in May and below the +5% overweight in February. Over +50% is bearish. A washout low (bullish) is under +15%. More on this indicator here.
- Regions:
- US (-15%): Exposure to the US rose slightly to -15% underweight from -18% in May; it's not much different than the -19% underweight in February, which was an 8 year low.
- Europe (+26%): Exposure to Europe was unchanged at +26% overweight.
- Japan (-6%): Exposure to Japan was unchanged at -6% underweight. Funds were -20% underweight in December 2012 when the Japanese rally began.
- EM (+6%): Exposure to EM rose to +6% overweight - a 21-month high - from -33% underweight in January and +2% overweight in May. -34% underweight in September 2015 was the lowest in the survey's history.
- Bonds (-34%): A net -34% are underweight bonds, a rise from -64% in December and-41% in May. This is a 3.5 year high allocation. Note that global bonds started to underperform in mid-2010, 2011 and 2012 when they reached -20% underweight.
- Commodities (-12%): A net -12% are underweight commodities - a 12-month high - an improvement from -19% last month. Higher commodity exposure goes in hand with improved sentiment towards EM.
- Macro: 23% expect a stronger global economy over the next 12 months; in February, 16% expected a weaker economy, the most pessimistic since December 2011.
If you find this post to be valuable, consider visiting a few of our sponsors who have offers that might be relevant to you.