Sharp sell offs tend to continue lower in the following day(s). Down momentum normally takes time to dissipate. A lower low is likely still ahead.
But sell offs triggered by a shock event like "Brexit" tend to bottom and then reverse rather quickly. That is likely now as well as investors realize that the non-binding vote will have little material affect within the next year or two, if ever. Moreover, several studies related to extremes in volatility and sentiment suggest US equities are nearing a point where a reversal higher is very likely.
* * *
In our last market summary three weeks ago, the near term set-up was for a mild mid-June swoon: the SPX had reached a prior resistance zone, some measures of short-term sentiment were excessively bullish and June is a seasonally weak month, with most of that weakness taking place during the middle 3 weeks. Since then, SPX has lost 3%. That post is here.
Our longer term view was that further gains lie ahead for the US indices: a sell off in June is frequently a set up for higher prices into summer. That is still our view.
Three weeks ago, the SPX was within 1% of its all-time highs (ATH) where every rally in the past 16 months has failed (blue arrow). Moving through this thick overhead resistance has once again proved difficult. At the end of this week, SPX closed about 1% above mid-May support near 2020. Below this level, and SPX will have made a "lower low", raising the risk of reentering the "hot mess" from August/September 2015 and January/February 2016 (enlarge any chart by clicking on it).
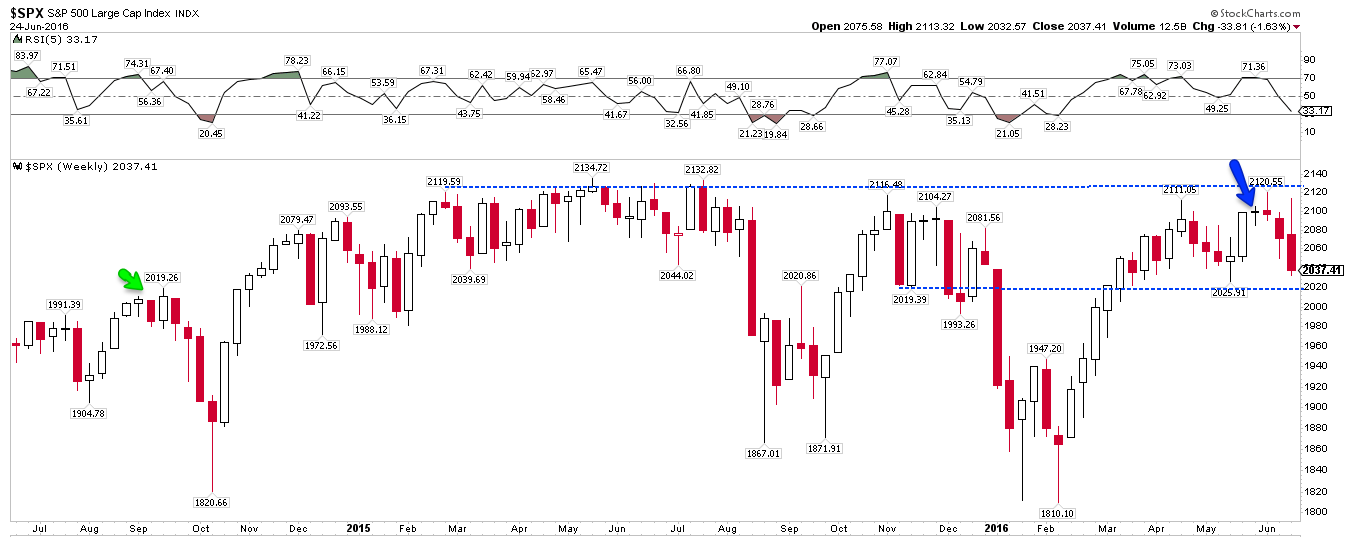
While 2020 is important initial support, from a practical standpoint SPX has additional support at 2000 and 1980. Flat trading ranges like this create multiple levels of support.
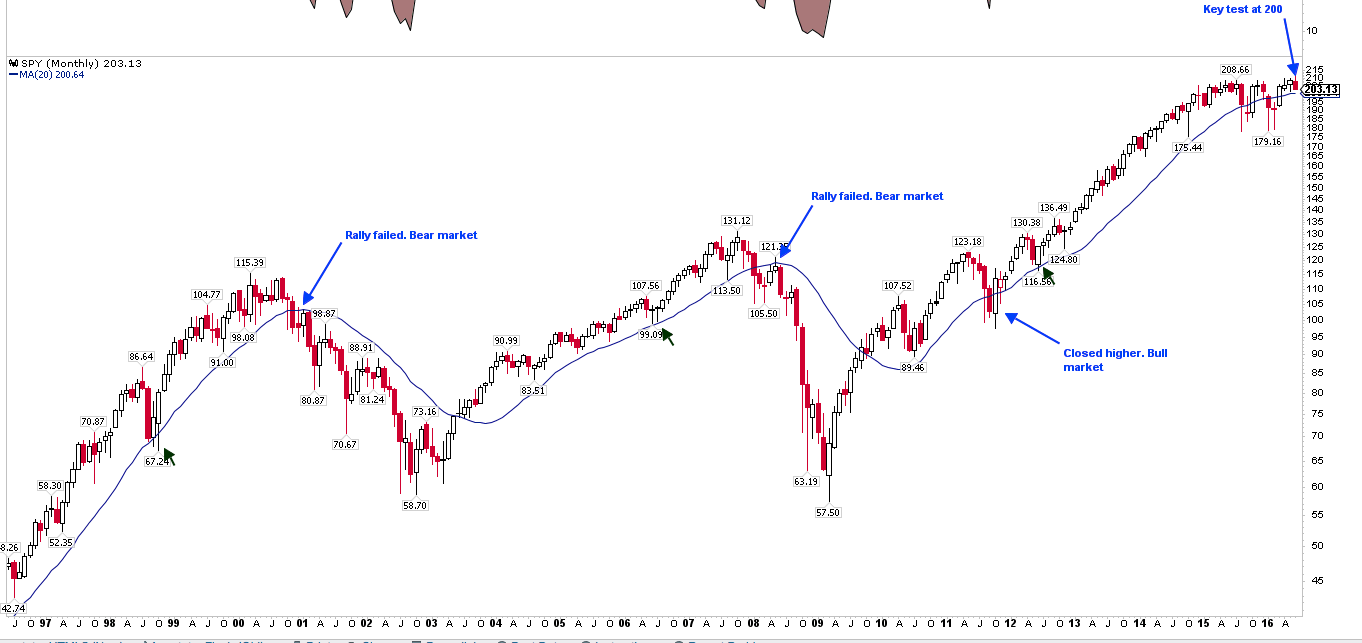
The back and forth trading in the S&P is starting to create and unfavorable pattern. The 20-month moving average (blue line) is flattening, as it did prior to the two most recent bear markets. A monthly close under 2000 (200 in SPY) will be a red flag. Any analysis based on a sample size of two is worthless on its own; confirmation from other indictors is needed. But it's not hard to see that a prolonged loss in upward momentum can lead prices lower; that will be the case now if SPY closes below 200 this month and again in July (note the failed backtests of the 20-mma at prior peaks).
Trading in June has been driven almost exclusively by the UK's referendum on whether to exit the EU. After making a new ATH on June 8, polling in the UK started to show a higher than expected probability of a "Brexit." SPY traded lower the next 5 days in a row, losing $4.0. But during this time, overnight trading accounted for a loss of $4.2. Cash hours in the US traded higher by $0.2. In other words, concern over the referendum was the source of more than 100% of the loss.
On Thursday, SPY closed very near its ATH again, and traded above the ATH after cash hours. It was assumed that Brexit had failed. All of the losses for the month of June occurred on Friday when the UK voted in favor of leaving the EU.
The outcome of the vote was a shock. Euro Stoxx lost 7% on Friday. The Pound lost 9% after trading at its highest level in 6 months on Thursday.
The referendum is a non-economic shock. The vote is non-binding. The UK may or may not begin a 2-3 year process of renegotiating its treaties with the EU. Politicians in the UK are already walking back their intent to leave the EU. From a practical standpoint, the referendum represents uncertainty but changes little any time this year or next year (from Capital Economics).

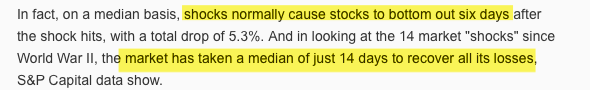
Non-economic shocks tend to leave minimal damage to stock indices. In a study of 51 geopolitical shocks complied by Ned Davis, US equities gained more than 6% in the following year (read more here). Similarly, in a study of 14 non-economic shocks since WWII, S&P Capital found that US indices bottomed within 6 days and had regained all of the losses within 2 weeks (read more here).
The impact for the US should the UK fall into a recession is probably very minor: trade between the UK and the US represents just 0.5% of US GDP.
That said, the selling in the US is probably not over. Strong down momentum like Friday's tends to carry over into the following days. The worst of the selling may be over but price still needs to hammer out a low.
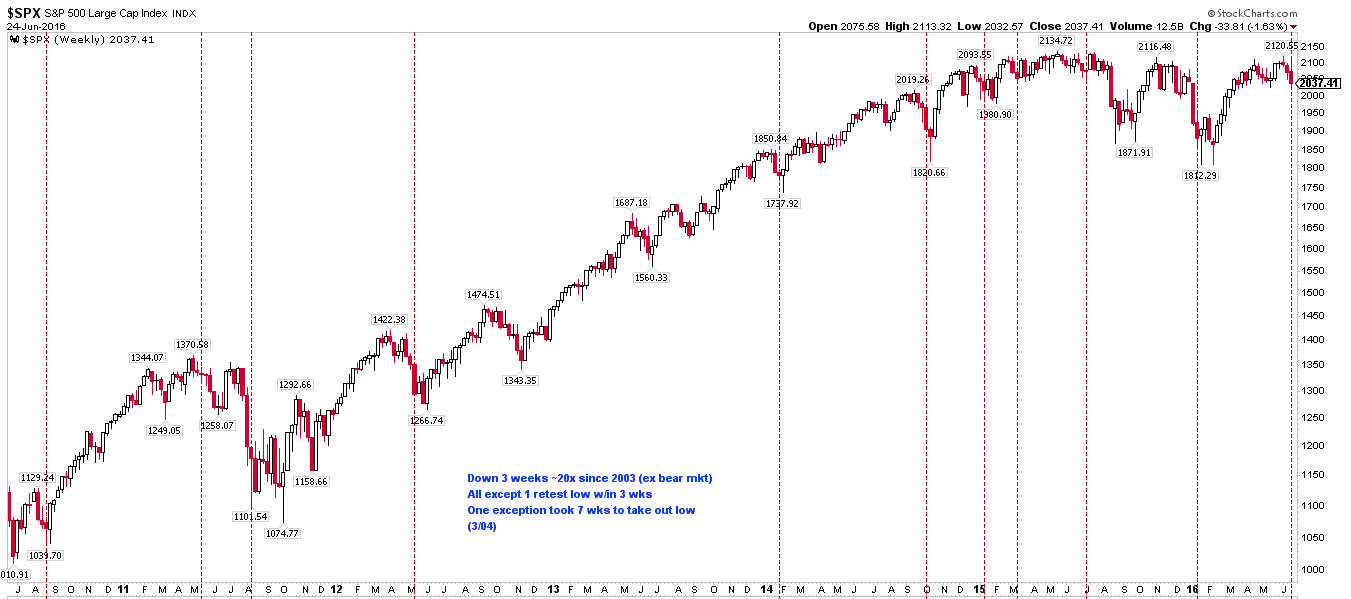
SPX has now fallen 3 weeks in a row (vertical lines). As in the past, the low from this week is very likely to be tested again (or exceeded) before the selling has concluded.
Similarly, SPY lost more than 3% on Friday. It was the largest one-day sell off since August 2015. Before that, there hasn't been a larger one day sell off since 2011. Strong down momentum normally needs time to dissipate before price bottoms and reverses. A lower low is likely.
The selling on Friday also came with more than 90% down volume on the NYSE: a major distribution day (MDD). Moreover, Trin (also called the Arms Index) closed above 2.0. Trin is a breadth indicator, derived by dividing the advance-decline ratio for issues by that for volume. A close over 2 means that down-volume was twice down-issues; in other words, stocks fell on relatively high volume. A post on this is here.
The next two charts show similar instances where Trin was over 2 (middle panel). A spike higher in Trin can be close to a capitulation low in SPY, but a lower low has usually occurred first. That is especially the case when the spike in Trin occurs together with a MDD (lowest panel).
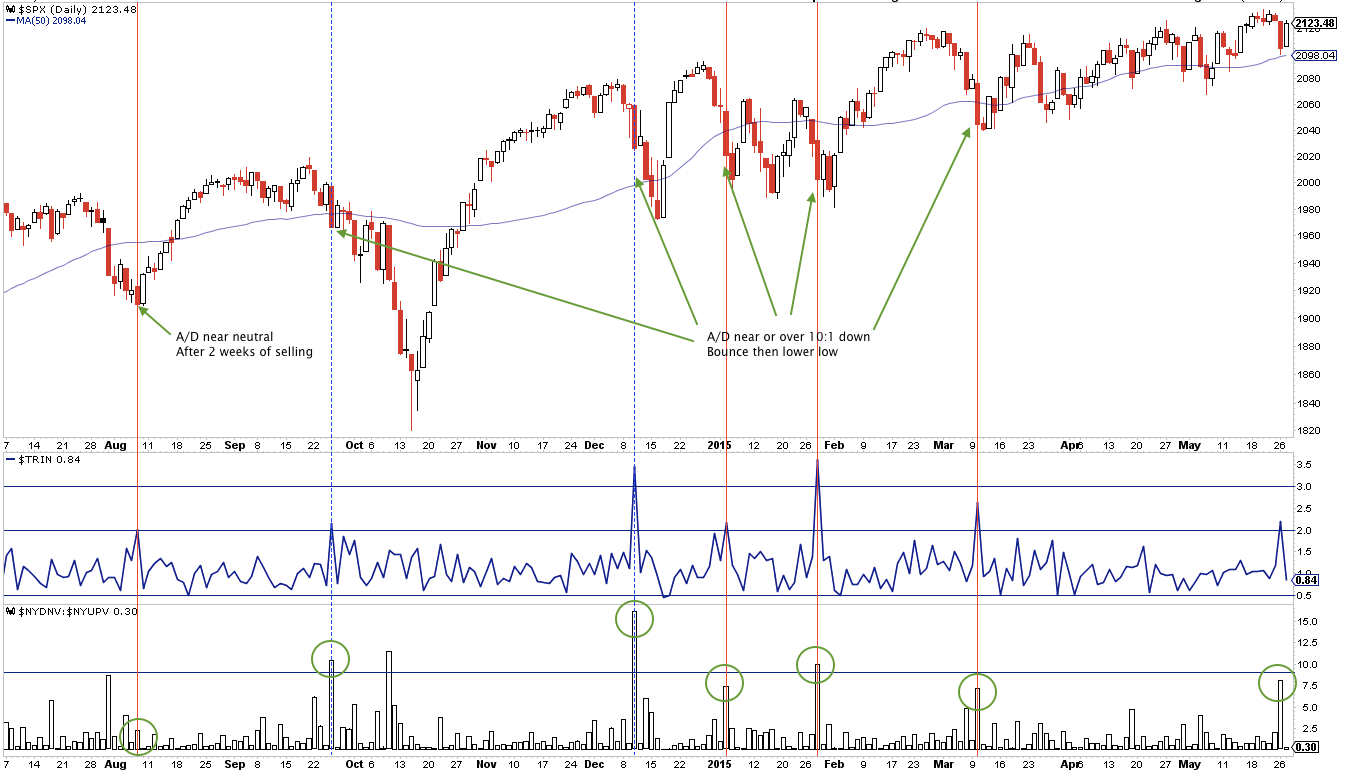
What is worrisome about Friday's sell off is that it occurred from the top of the trading range. Similar instances of high volume selling show a greater propensity for more losses in the days ahead.

The cleanest trading set up is if SPY keeps selling off to start the new week, ideally creating a reversal candle where the low can be used as a stop to trade long against. Why trade long? Because there are several reasons to expect a bounce higher to begin relatively soon.
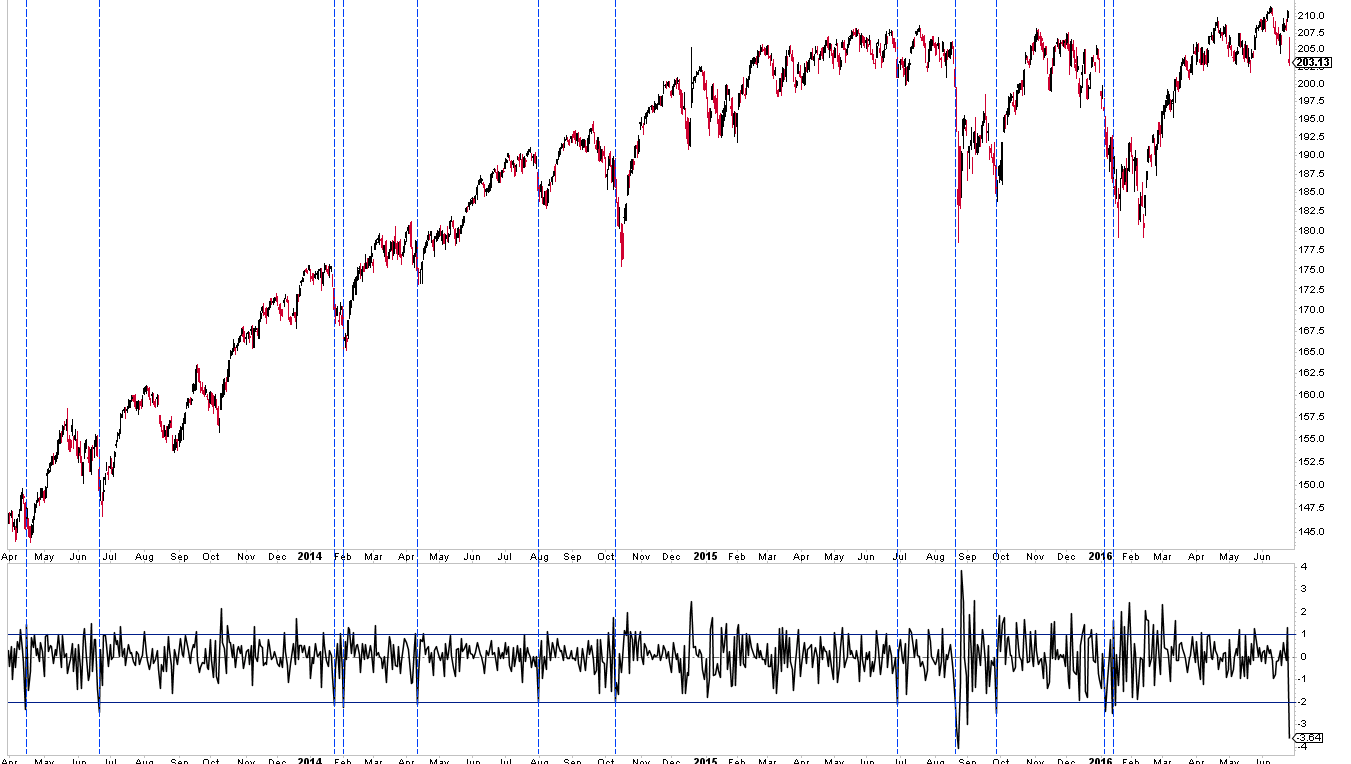
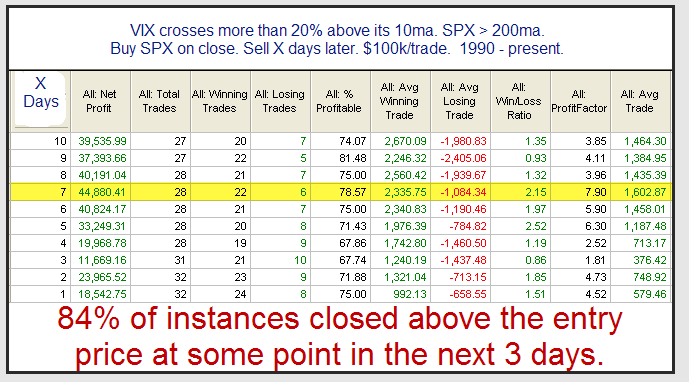
Vix gained 49% on Friday, closing at the highest level since the mid-February low in SPY. Vix also closed more than 25% above its 10-dma. In similar instances in the past, SPY has closed higher within 3 days 84% of the time and been higher 1-1/2 to 2 weeks later more than 75% of the time (from Rob Hanna, here).
Moreover, 1-month volatility (Vix) is now at a premium to 3-month volatility (Vxv), creating an inverted term structure. The premium is the most extreme since the October 2014 and August 2015 lows in SPY. In both cases, equities were within 1-2 days of a low and the start of vicious bounce higher. In other words, SPY may not be at the low, but it should be close. This is where significant reversals often occur.
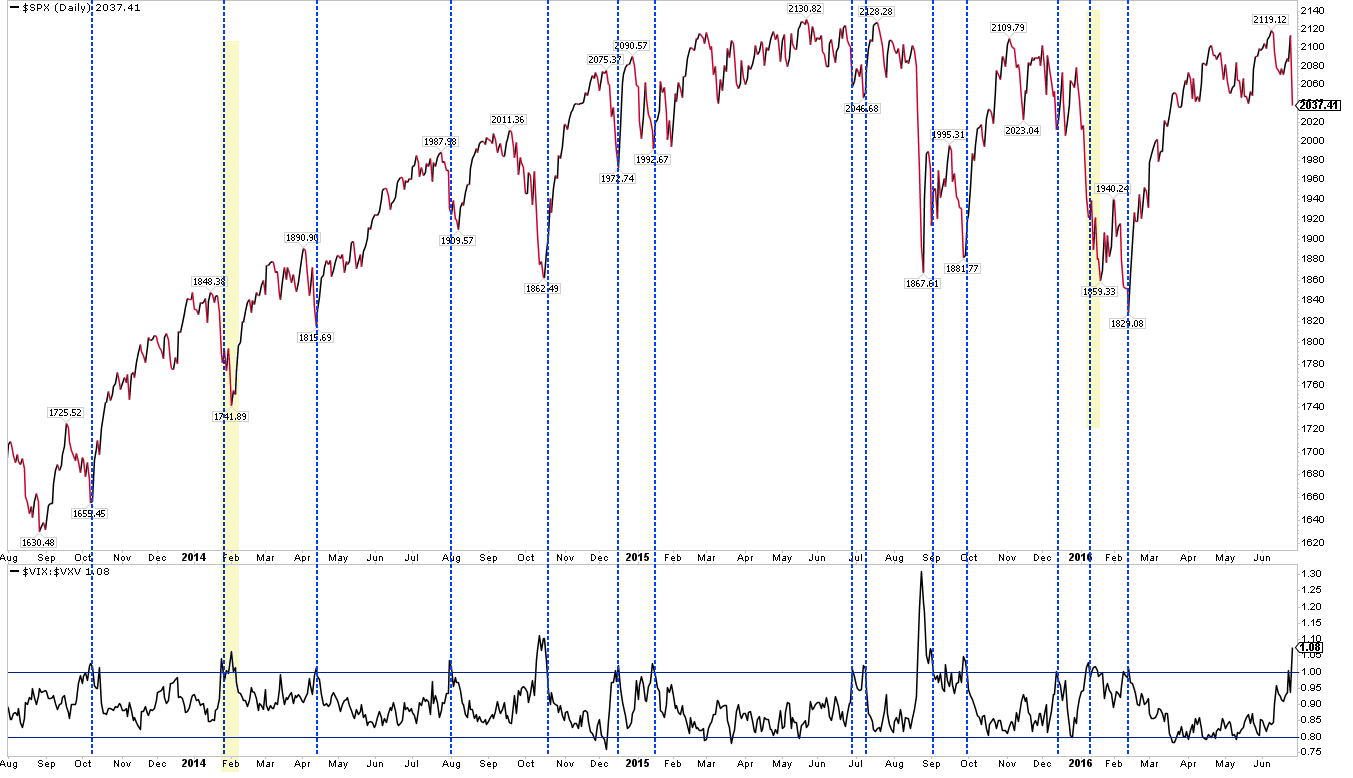
Those reversals are very likely when the term structure inverts and SPX has been near a 52-week high. SPX has been higher 11 of the past 12 times by a medium of 3% over the next two weeks in similar instances since 2007 (from Dana Lyons, here).

Put/call ratios, similarly, have spiked higher as investors have sought downside protection. This is reaching an extreme. On Friday, the equity-only put/call ratio closed over 1 for only the 6th time in the past 5 years. Each time, SPY has closed higher within the next 5 days with a median gain of 1.2%.
The 10-day average total put/call ratio is back to the highs from mid-May, from which SPY gained more than 3%. Again, further selling in the next day or so will likely push this to a greater extreme.

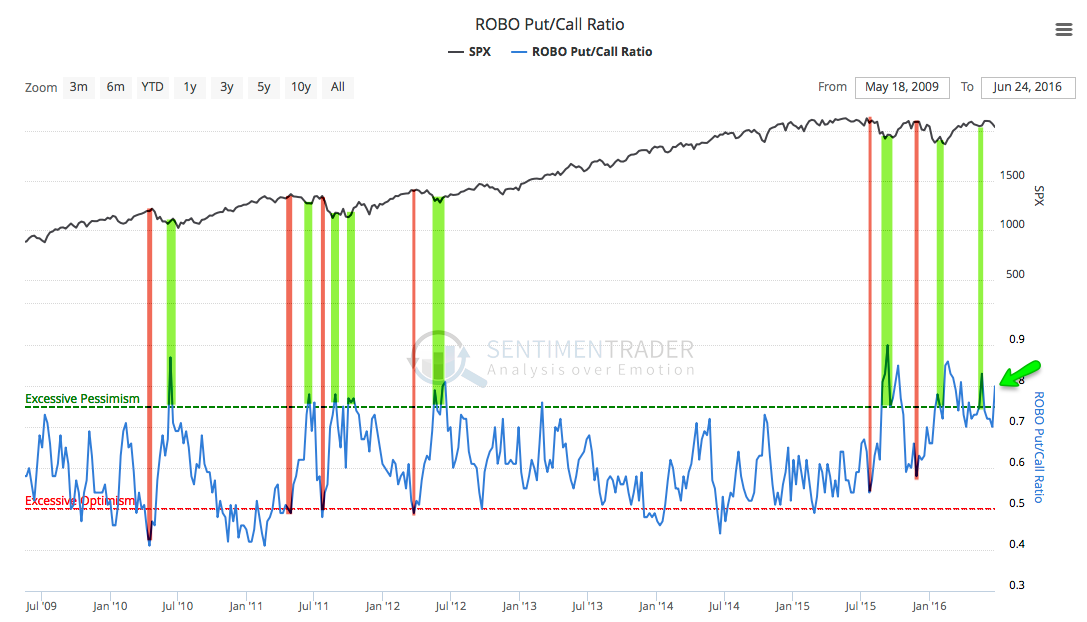
Looking only at small investor opening put/call transactions gives a cleaner view of how retail investors are getting positioned by excluding the hedging transactions of large investors. Noteworthy near term tops in SPY have only arrived when call buying has dominated (red lines). That's not the case at present. Instead, put buying is now dominant and this when bottoms have been close to forming. Again, note May, from which SPY rose 3% in the following weeks (from Sentimentrader).
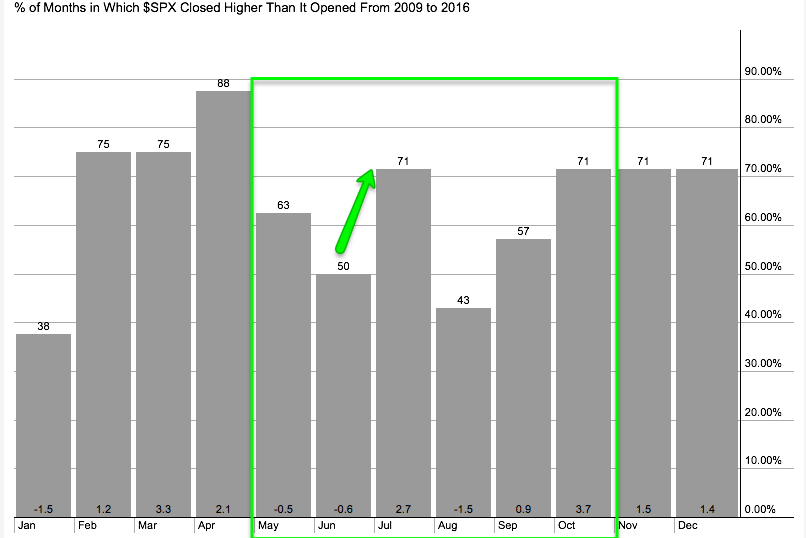
The weak mid-June period has mostly passed. Like most months, June tends to end strongly and July tends to also start strongly. Friday was the end of the 18th trading day of June (from Stock Almanac).

Recall that while June has been one of the weaker months of the summer, July is typically one of the summer's best months for equities.
The first bounce in SPY, whether it occurs before or after a "lower low," will likely run into initial resistance at the declining 5-dma (green line; arrows). The first indication that the short-term trend is turning more positive will be when the 5-dma flattens and then starts to rise.

On the economic calendar this week: GDP on Tuesday and personal income on Wednesday.
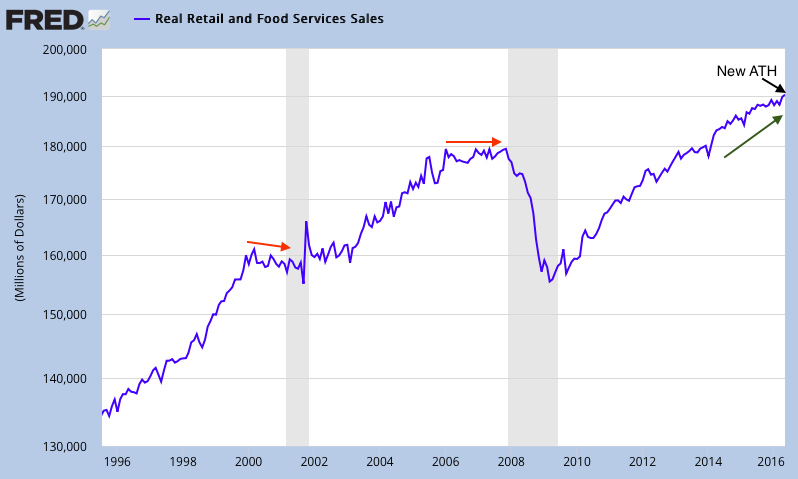
Recent macro data remains mostly positive in the US. 70% of US freight is carried by trucks. In May, truck tonnage was up 6% yoy and very near an ATH.

May retail sales also reached a new ATH. Growth in both retail sales and truck tonnage will mostly likely flatten ahead of the next recession.
In summary: during the past three weeks, equities have been driven - higher and lower - almost exclusively by the UK referendum on whether to exit the EU. The decision to leave caused the largest one-day sell off since August 2015. Sharp sell offs tend to continue lower in the following day(s). Down momentum normally takes time to dissipate. A lower low is likely still ahead.
But sell offs triggered by a shock event like "Brexit" tend to bottom and then reverse rather quickly. That is likely now as well as investors realize that the non-binding vote will have little material affect within the next year or two, if ever. Moreover, several studies related to extremes in volatility and sentiment suggest US equities are near a point where a reversal higher is very likely.
If you find this post to be valuable, consider visiting a few of our sponsors who have offers that might be relevant to you.