Friday, October 28, 2016

Has US Debt Reached A Tipping Point?

Summary: Investors have become very concerned about excessive debt in the US. The worry is that current leverage has risen so rapidly and become so extreme that the economy is at imminent risk of a crisis. Is this concern valid?

In this post, we break US debt into its main components: government, corporate and household. We compare each to their historical levels to determine whether current leverage levels have previously led to adversity. More importantly, we assess whether current leverage levels for each are sustainable.

The rise in US debt is primarily due to the federal government and corporates. Objectively, it is hard to see the case for either being a worrisome risk at present: their liabilities and interest expenses can be covered many times over by assets and income.

Moreover, households have deleveraged during the current cycle. This is quite unlike other periods of economic expansion. Given the importance of consumer spending to overall economic growth, current consumer debt levels are likely to be more of a tailwind for the economy than an impending risk.

* * *

There is a good chance that you have seen a picture of US debt like this one. It compares total US debt, held by the government, corporations and households, to the US economy. By this view, total US debt is very high by historical standards and has grown too rapidly. Enlarge any chart by clicking on it (chart from the Federal Reserve).


Friday, October 21, 2016

Fund Managers' Current Asset Allocation - October

Summary: Throughout 2013, 2014 and early 2015, fund managers were heavily overweight equities and underweight cash and bonds. Those allocations have entirely flipped in 2016, with investors persistently shunning equities in exchange for holding cash.

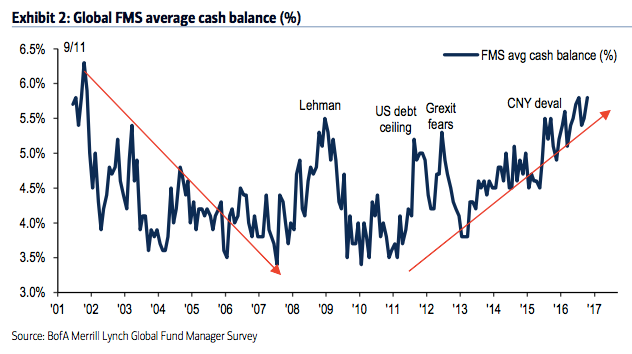
Global equities are more than 15% higher than in February. A tailwind for this rally has been the bearish positioning of investors, with fund managers' cash in October rising to the highest level since 2001. Similarly, their equity allocations are now like those in February, mid-2010 and mid-2012, periods which were notable lows for equity prices during this bull market. Overall, fund managers' defensive positioning supports higher equity prices in the month(s) ahead.

Allocations to US equities had been near 8-year lows over the past year and half, during which the US outperformed most of the world. After rising for two months during the summer, allocations fell again to underweight in both September and October. Bearish sentiment remains a tailwind for US equities.

European equity markets, which had been the consensus overweight and also the world's worst performing region, are now underweighted relative to their long term mean.  Investors are chasing the world's best performing region - emerging markets - which now have their highest overweight in 3 1/2 years. Emerging markets may rise further but note that the contrarian long trade is now over.

* * *

Among the various ways of measuring investor sentiment, the BAML survey of global fund managers is one of the better as the results reflect how managers are allocated in various asset classes. These managers oversee a combined $600b in assets.

The data should be viewed mostly from a contrarian perspective; that is, when equities fall in price, allocations to cash go higher and allocations to equities go lower as investors become bearish, setting up a buy signal. When prices rise, the opposite occurs, setting up a sell signal. We did a recap of this pattern in December 2014 (post).

Let's review the highlights from the past month.

Cash: Fund managers' cash levels at the equity low in February were 5.6%. Despite the rise in global equities since then, cash levels are now higher, at 5.8%. This is equal to the high after the Brexit vote in July, higher than at any time during the 2008-09 bear market and at the highest since November 2001. Even November 2001, which wasn't a bear market low, saw equities rise nearly 10% in the following 2 months.  High cash levels are supportive of further gains in equities in the month(s) ahead. Enlarge any image by clicking on it.


Friday, October 7, 2016

October Macro Update: Solid Wage Growth But Housing Construction Flattening

SummaryThe macro data from the past month continues to mostly point to positive growth. On balance, the evidence suggests the imminent onset of a recession is unlikely.

Overall, the main positives from the recent data are in employment, consumption growth and housing:
  • Monthly employment gains have averaged more than 200,000 during the past year, with annual growth of 1.7% yoy.  Full-time employment is leading.
  • Recent compensation growth is the highest in 7 years: 2.7% yoy in July and 2.6% in September. 
  • Most measures of demand show 3-4% nominal growth. Real personal consumption growth in August was 2.6%.  Retail sales reached a new all-time high in July.
  • Housing sales are near a 9 year high. Starts and permits in August remain near their 8 year highs.
  • The core inflation rate has remained above 2% since November 2015.
The main negatives are concentrated in the manufacturing sector (which accounts for just 10% of GDP):
  • Core durable goods growth fell 3.7% yoy in August. It was weak during the winter of 2015 and it has not rebounded since. 
  • Industrial production has also been weak, falling -1.1% yoy due to weakness in mining (oil and coal). The manufacturing component fell -0.2% yoy.
Prior macro posts from the past year are here.

* * *

Our key message over the past 2 years has been that (a) growth is positive but slow, in the range of ~3-4% (nominal), and; (b) current growth is lower than in prior periods of economic expansion and a return to 1980s or 1990s style growth does not appear likely.

Modest growth should not be a surprise. This is the typical pattern in the years following a financial crisis like the one experienced in 2008-09.

This is germane to equity markets in that macro growth drives corporate revenue, profit expansion and valuation levels. The saying that "the stock market is not the economy" is true on a day to day or even month to month basis, but over time these two move together. When they diverge, it is normally a function of emotion, whether measured in valuation premiums/discounts or sentiment extremes (enlarge any image by clicking on it).


A valuable post on using macro data to improve trend following investment strategies can be found here.

Let's review each of these points in turn. We'll focus on four macro categories: labor market, inflation, end-demand and housing.


Employment and Wages

The September non-farm payroll was 156,000 new employees less 7,000 in revisions.

In the past 12 months, the average monthly gain in employment was 204,000.

Monthly NFP prints are normally volatile. Since 2004, NFP prints near 300,000 have been followed by ones near or under 100,000. That has been a pattern during every bull market; NFP was negative in 1993, 1995, 1996 and 1997. The low prints of 84,000 in March 2015 and 24,000 in May 2016 fit the historical pattern. This is normal, not unusual or unexpected.