Wednesday, January 18, 2017

Fund Managers' Current Asset Allocation - January

Summary: Global equities are nearly 25% higher than in February 2016. A tailwind for this rally has been the bearish positioning of investors, with fund managers persistently shunning equities in exchange for holding cash.

That's no longer the case.  Fund managers became bullish again in December, and remain so now. Optimism towards the economy has surged to a 2-year high. Cash remains in favor (a positive) but global equity allocations are now back above neutral for the first time in a year. Another push higher and excessive bullish sentiment will become a headwind. The main exception to this is emerging markets, which are now out of favor and a contrarian long.

Findings in the bond market are of greatest interest. Fund managers' allocations to global bonds are now at prior capitulation lows. Moreover, inflation and growth expectations have jumped to the highest level since early 2011, after which US 10-year yields fell in half over the next several months.

The dollar is now considered the most overvalued in the past 10 years. Under similar conditions, the dollar has fallen in value in the month(s) ahead.

* * *

Among the various ways of measuring investor sentiment, the BAML survey of global fund managers is one of the better as the results reflect how managers are allocated in various asset classes. These managers oversee a combined $500b in assets.

The data should be viewed mostly from a contrarian perspective; that is, when equities fall in price, allocations to cash go higher and allocations to equities go lower as investors become bearish, setting up a buy signal. When prices rise, the opposite occurs, setting up a sell signal. We did a recap of this pattern in December 2014 (post).

Let's review the highlights from the past month.

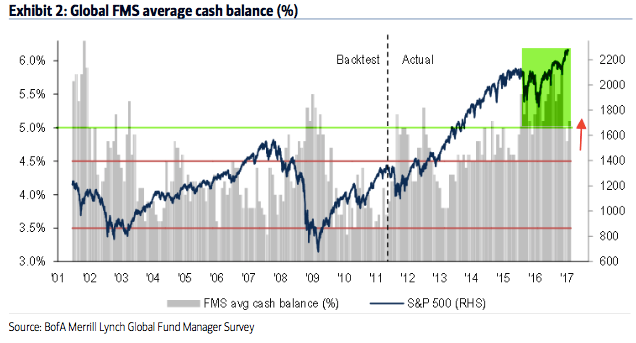
Cash: Fund managers' cash levels dropped from 5.8% in October to 5.1% in January; cash is up slightly from December. Recall that 5.8% was the highest cash level since November 2001. Cash remained above 5% for almost all of 2016, the longest stretch of elevated cash in the survey's history. Some of the tailwind behind the rally is now gone but cash is still supportive of further gains in equities. A significant further drop in cash in the month ahead, however, would be bearish. Enlarge any image by clicking on it.


Friday, January 6, 2017

Weekly Market Summary

Summary: US equities are starting the year at new all-time highs. The rally is supported by healthy breadth and a relatively solid economic foundation. The biggest watchout is volatility, which has fallen to an extreme. A mean reversion in volatility is odds-on and that is normally unfavorable, short term, for equities.

* * *

Today, SPX, DJIA, COMPQ and NDX have all made new all-time highs (ATH). All of the moving averages, from 5-d to 200-d, are rising for each of the respective indices. This is the definition of an uptrending equity market. Enlarge any chart by clicking on it.


January Macro Update: Wage Growth At New High

SummaryThe macro data from the past month continues to mostly point to positive growth. On balance, the evidence suggests the imminent onset of a recession is unlikely.

That said, there are some signs of weakness creeping into the data. Employment growth is decelerating, from over 2% last year to 1.5% now. Housing starts and permits have flattened over the past year. There is nothing alarming in any of this but it is noteworthy that expansions weaken before they end, and these are signs of some weakening that bear monitoring closely.

Overall, the main positives from the recent data are in employment, consumption growth and housing:
  • Monthly employment gains have averaged 180,000 during the past year, with annual growth of 1.5% yoy.  Full-time employment is leading.
  • Recent compensation growth is the highest in 7-1/2 years: 2.9% yoy in December. 
  • Most measures of demand show 3-4% nominal growth. Real personal consumption growth in November was 2.8%.  Retail sales reached a new all-time high in November, growing 2.0% yoy.
  • Housing sales are near a 9 year high. Starts made a new 9 year high in October.
  • The core inflation rate has remained near 2% since November 2015.
The main negatives are concentrated in the manufacturing sector (which accounts for less than 10% of employment):
  • Core durable goods growth rose 1.8% yoy in November, it's best growth since April 2015. It was weak during the winter of 2015 and it has not rebounded since. 
  • Industrial production has also been weak, falling -0.6% yoy due to weakness in mining (oil and coal). The manufacturing component grew +0.4% yoy.
Prior macro posts are here.

* * *

Our key message over the past 4 years has been that (a) growth is positive but slow, in the range of ~3-4% (nominal), and; (b) current growth is lower than in prior periods of economic expansion and a return to 1980s or 1990s style growth does not appear likely.

Modest growth should not be a surprise. This is the typical pattern in the years following a financial crisis like the one experienced in 2008-09.

This is germane to equity markets in that macro growth drives corporate revenue, profit expansion and valuation levels. The saying that "the stock market is not the economy" is true on a day to day or even month to month basis, but over time these two move together. When they diverge, it is normally a function of emotion, whether measured in valuation premiums/discounts or sentiment extremes (enlarge any image by clicking on it).


A valuable post on using macro data to improve trend following investment strategies can be found here.

Let's review each of these points in turn. We'll focus on four macro categories: labor market, inflation, end-demand and housing.


Employment and Wages

The December non-farm payroll was 156,000 new employees plus 19,000 in revisions.

In the past 12 months, the average monthly gain in employment was 180,000.

Monthly NFP prints are normally volatile. Since 2004, NFP prints near 300,000 have been followed by ones near or under 100,000. That has been a pattern during every bull market; NFP was negative in 1993, 1995, 1996 and 1997. The low prints of 84,000 in March 2015 and 24,000 in May 2016 fit the historical pattern. This is normal, not unusual or unexpected.