Tuesday, April 25, 2017

Fund Managers' Current Asset Allocation - April

Summary: A tailwind for the rally since February 2016 has been the bearish positioning of investors, with fund managers persistently shunning equities in exchange for holding cash.

Fund managers have become more bullish, but not excessively so. Profit expectations are near a 7-year high and global economic growth expectations are near a 2-year high.  However, cash balances at funds remains high, suggesting lingering doubts and fears.

Of note is that allocations to US equities dropped to their lowest level in 9 years in April: this is when US equities typically start to outperform. In contrast, weighting towards Europe and emerging markets have jumped to levels that strongly suggest these regions are likely to underperform.

Fund managers remain stubbornly underweight global bonds due to heightened growth and inflation expectations. Current allocations have often marked a point of capitulation where yields reverse lower and bonds outperform equities.

For the fifth month in a row, the dollar is considered the most overvalued in the past 11 years. Under similar conditions, the dollar has fallen in value in the month(s) ahead.

* * *

Among the various ways of measuring investor sentiment, the BAML survey of global fund managers is one of the better as the results reflect how managers are allocated in various asset classes. These managers oversee a combined $600b in assets.

The data should be viewed mostly from a contrarian perspective; that is, when equities fall in price, allocations to cash go higher and allocations to equities go lower as investors become bearish, setting up a buy signal. When prices rise, the opposite occurs, setting up a sell signal. We did a recap of this pattern in December 2014 (post).

Let's review the highlights from the past month.

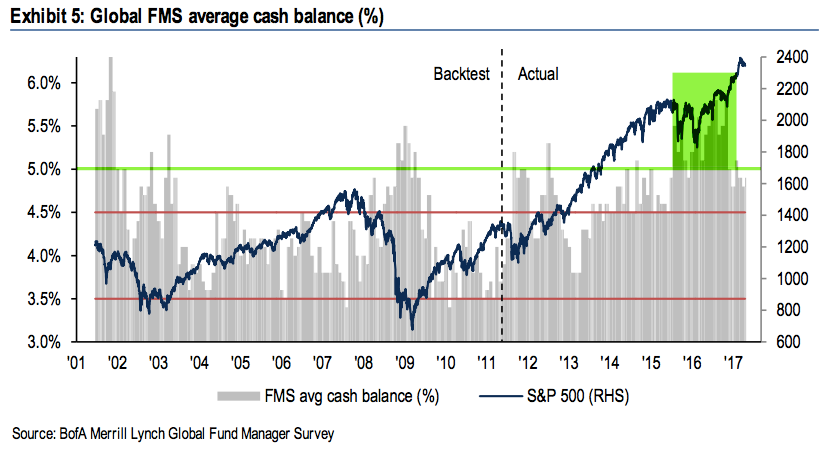
Cash: Fund managers' cash levels dropped from 5.8% in October 2016 to 4.9% in April. Recall that 5.8% was the highest cash level since November 2001. Cash remained above 5% for almost all of 2016, the longest stretch of elevated cash in the survey's history. Some of the tailwind behind the rally is now gone but cash is still supportive of further gains in equities. A significant further drop in cash in the month ahead, however, would be bearish. Enlarge any image by clicking on it.


Sunday, April 23, 2017

Weekly Market Summary

Summary: A week ago, a number of notable short-term extremes in sentiment, breadth and volatility had been reached, suggesting a rebound in equities was ahead. In the event, US equities gained 1% and both NDX and COMPQ made new ATHs.

But new uptrends are marked by indices impulsing higher as investors quickly reposition and chase price. Momentum quickly becomes overbought. Neither of these has happened, at least not yet. Some clarity from the French elections this weekend could free equities to move higher. Should SPX instead rollover, breaking the recent low on April 13 and head to the 2300 area, it's a good guess that a stronger rebound will follow: there are several indications that short-term investor sentiment has already become too bearish.

* * *

Since reaching an all-time high (ATH) on March 1, SPX has traded sideways in a 3% range. The ATH came on the day of the new president's State of the Union address and also corresponded with bullish sentiment extremes in, for example, the equity-only put/call ratio and the Investors Intelligence survey. Our recent posts have emphasized that these extremes, together with the subsequent loss in price momentum, are most often associated with a mild correction of 3-5%. A return to the 2300 area for SPX appeared to be odds-on. Read more on these points here and here.


Friday, April 14, 2017

Weekly Market Summary

Summary: US indices closed lower this week, but not by much. SPX lost just 1% and is just 3% from its all-time high. A number of notable short-term extremes in sentiment, breadth and volatility were reached on Thursday that suggest equities are at or near a point of reversal higher. The best approach is to continue to monitor the market and adjust with new data. That said, it's a good guess that SPX still has further downside in the days/weeks ahead.

* * *

Our last several posts have emphasized several points:
Strong uptrends (like this one) weaken before they reverse, meaning the current sell off is unlikely to lead directly into a major correction. 
Even years with powerful returns (like 2013) experience multiple drawdowns of 3-8% along the way, meaning the current sell off was due and is perfectly normal. 
There are a number of compelling studies suggesting that 2017 will continue to be a good year for US equities, meaning equities will likely end the year higher. 
Read more on these points here and here.

SPX ended the week at 2328, 3% off it's all-time high (ATH) made on March 1. That is a very mild drawdown. Our post last week argued that a sell off to at least the 2300 area (4% off the ATH) was likely. From that respect, a lower low is likely to still lie ahead. That post is here.

There were a number of notable short-term extremes in sentiment, breadth and volatility reached on Thursday that suggest a rebound in equities is ahead. Let's review these.

First, the equity-only put/call ratio reached a rare extreme on Thursday, with nearly as many puts as calls being traded on the day. That has happened only about a dozen times in the past 8 years. All of these have been at or near a short-term low in SPX (green lines). A rebound is likely ahead. That rebound might not last long, however: note that in several instances, the low was retested or exceeded in the days/weeks ahead (red arrows). Enlarge any chart by clicking on it.


Saturday, April 8, 2017

Weekly Market Summary

Summary: US indices made their all-time high in early March; aside from the Nasdaq, which made new highs this week, these indices have since moved sideways. SPX has alternated up and down 5 weeks in a row, producing little net gain. Seasonality is particularly strong in April, so a fuller retest of the March highs might still be ahead this month. And indications that 2017 will be a good year for equities continue to add up. But there is a notable set up in place for the first correction since November to trigger. This week is likely to be pivotal.

* * *

Our last weekly summary post two weeks ago emphasized two points. First, that strong uptrends weaken before they strongly reverse. Second, that even years with powerful returns (think 2013's 30% gain) experience multiple drawdowns of 3-8% along the way, meaning the smooth uptrend that had been in place from November to March has likely ended. That post is here.

In the event, SPX reversed and gained 2% at its highest point in the following week. That high was less than 1% from the index's all-time high (ATH). The broader NYSE was similar. Both NDX and COMPQ made new ATHs this week.

Still, it's accurate to say the reversal in equities has been weak so far. Uptrends (green arrows) are partially defined by their ability to become and then stay overbought (top panel). Since the State of the Union on March 1, SPX has failed in this regard. Short term moving averages are either declining or flat. Until this changes, SPX is likely to chop sideways or, more likely, test lower levels (yellow shading). Enlarge any chart by clicking on it.


Friday, April 7, 2017

April Macro Update: Employment Growth Continues to Decelerate

SummaryThe macro data from the past month continues to mostly point to positive growth. On balance, the evidence suggests the imminent onset of a recession is unlikely.

One concern in recent months had been housing, but revised data shows housing starts breaking above the flattening level that has existed over the past two years. A resumption in growth appears to be starting.

That leaves employment growth as the main watch out: employment growth is decelerating, from over 2% last year to 1.5% now. It's not alarming but it is noteworthy that expansions weaken before they end, and slowing employment growth is a sign of some weakening that bears monitoring.

A second watch out is demand growth. Real retail sales excluding gas is in a decelerating trend. In February, growth was just 1.8%. Personal consumption accounts for about 70% of GDP so weakening retail sales bears watching closely.

Overall, the main positives from the recent data are in employment, consumption growth and housing:
  • Monthly employment gains have averaged 178,000 during the past year, with annual growth of 1.5% yoy.  Full-time employment is leading.
  • Recent compensation growth is among the highest in the past 8 years: 2.7% yoy in March. 
  • Most measures of demand show 2-3% real growth. Real personal consumption growth in February was 2.6%.  Real retail sales (including gas) grew 2.8% yoy in February.
  • Housing sales grew 13% yoy in February. Starts grew 6% over the past year.
  • The core inflation rate is ticking higher but remains near the Fed's 2% target.
The main negatives are concentrated in the manufacturing sector (which accounts for less than 10% of employment):
  • Core durable goods growth rose 3.4% yoy in February. It was weak during the winter of 2015-16 and is slowly rebounding in recent months. 
  • Industrial production has also been weak; it's flat yoy due to weakness in mining (oil and coal). The manufacturing component grew 1.4% yoy in February.
Prior macro posts are here.

* * *

Our key message over the past 4 years has been that (a) growth is positive but slow, in the range of ~2-3% (real), and; (b) current growth is lower than in prior periods of economic expansion and a return to 1980s or 1990s style growth does not appear likely.

Modest growth should not be a surprise. This is the typical pattern in the years following a financial crisis like the one experienced in 2008-09.

This is germane to equity markets in that macro growth drives corporate revenue, profit expansion and valuation levels. The saying that "the stock market is not the economy" is true on a day to day or even month to month basis, but over time these two move together. When they diverge, it is normally a function of emotion, whether measured in valuation premiums/discounts or sentiment extremes (enlarge any image by clicking on it).


A valuable post on using macro data to improve trend following investment strategies can be found here.

Let's review each of these points in turn. We'll focus on four macro categories: labor market, inflation, end-demand and housing.


Employment and Wages

The March non-farm payroll was 98,000 new employees minus 38,000 in revisions.  In the past 12 months, the average monthly gain in employment was 178,000. Employment growth is decelerating.

Monthly NFP prints are normally volatile. Since 2004, NFP prints near 300,000 have been followed by ones near or under 100,000. That has been a pattern during every bull market; NFP was negative in 1993, 1995, 1996 and 1997. The low print of 98,000 this month, 84,000 in March 2015 and 24,000 in May 2016 fit the historical pattern. This is normal, not unusual or unexpected.


Monday, April 3, 2017

Interview With Financial Sense on Identifying an Equity Market Top

We were interviewed by Cris Sheridan of Financial Sense on March 28. During the interview, we discuss current market technicals, the macro-economic environment, the investor sentiment backdrop and the prospect for future equity returns. The theme of our discussion is what to look for at an equity market top.

Our thanks to Cris for the opportunity to speak with him and to his editor for making these disparate thoughts seem cogent.

Listen here.


If you find this post to be valuable, consider visiting a few of our sponsors who have offers that might be relevant to you.