This is the set up as markets enter December, typically the strongest month of the year for equities. As bullish as December tends to be, an intra-month drawdown of 2% has been common, even in recent years.
* * *
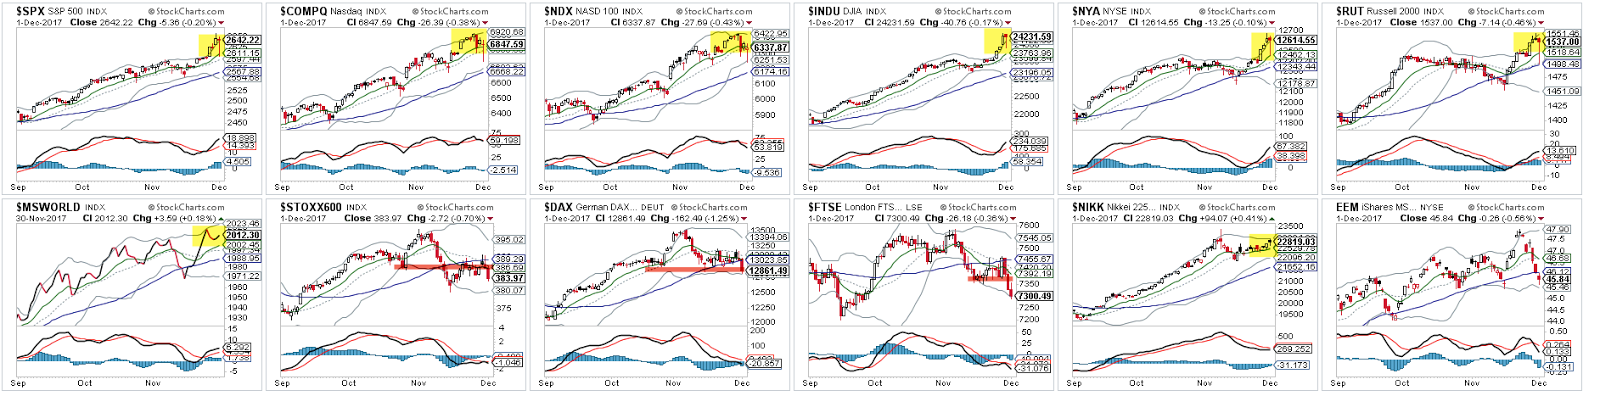
For the first time in a month, all US indices - SPX, NYSE, DJIA, COMPQ, NDX and RUT - made new all time highs (ATHs) this week. The dominant trend remains higher. Enlarge any image by clicking on it.
The transport sector and the industrials sector both made new ATHs this week as well, for the first time in nearly two months. Dow Theorists have their confirmation.
In the chart above, you'll see that things are much less rosy in Europe. Stoxx, DAX and FTSE have all broken below their respective 50-d. Recall that fund managers polled by BAML in November where massively overweight Europe and underweight the US, conditions under which we expected the US to outperform (more here).

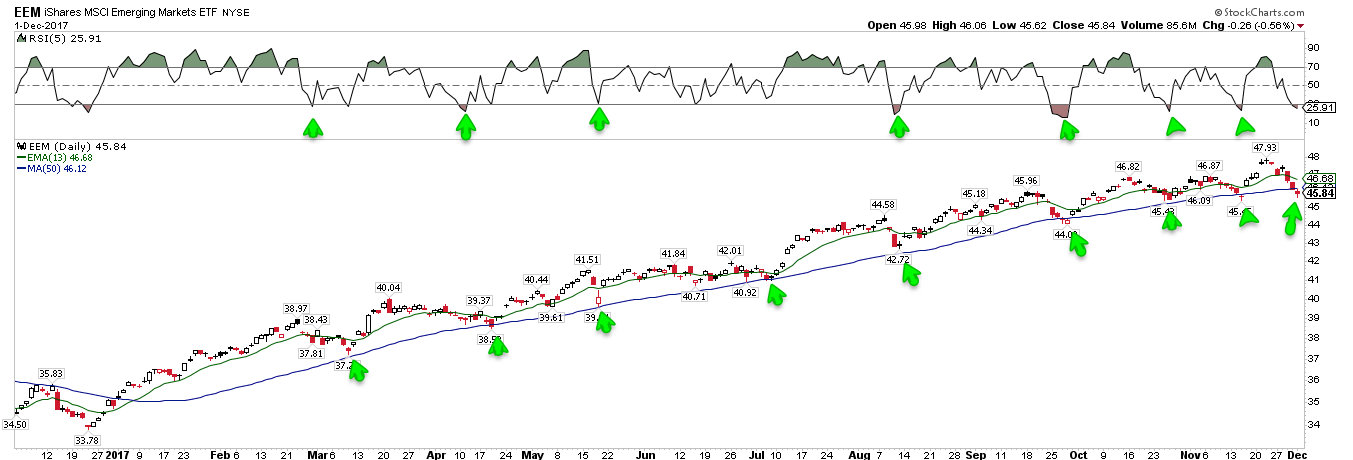
Emerging markets lost 4% in the past week and are now 2% lower than a month ago. EEM ended the week on its 50-d (blue line) and oversold (top panel). In the past year, this is when EEM has started to move higher. This is a key watch out for next week.
Back in the US, NDX has been leading all other indices higher this year. But after making a new ATH on Tuesday, the index dropped 1.4% in the next 3 days. It's unlikely Tuesday marked a significant long term top.
This week was the first loss in NDX since mid-September. Through last week, it had gained for 9 weeks in a row. The sample size is small, but that level of momentum has not previously marked a significant top: NDX was higher within the next month every time. Both NDX and SPX were higher a month later 5 of 6 times. SPX was higher between 1 and 3 months later all 6 times (from Nautilus).

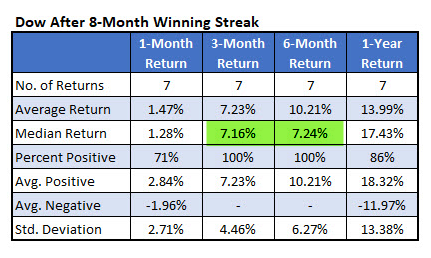
SPX rose for an 8th month in a row in November. Since 1980, this has happened just 5 other times with SPX rising a 9th month only once (in 1983). The current uptrend is extended and may be getting ready to take a short break.
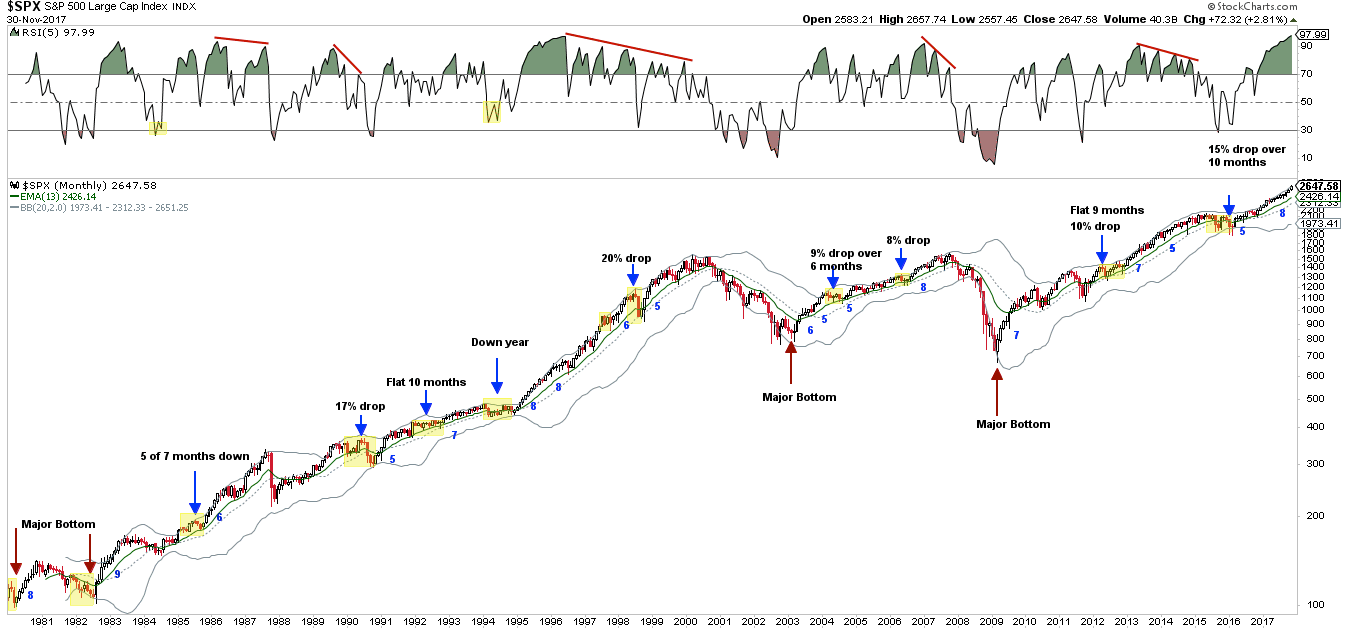
But the uptrend is unlikely to have made a significant top. In the chart above note that significant tops in 1987, 1990, 1998, 2000, 2007, 2011 and 2015 fit the pattern we have previously described many times: small weakness followed by larger weakness, with the top marked by a much shorter monthly uptrend (less than 4 months and more typically alternating up/down each month as participants search for direction).
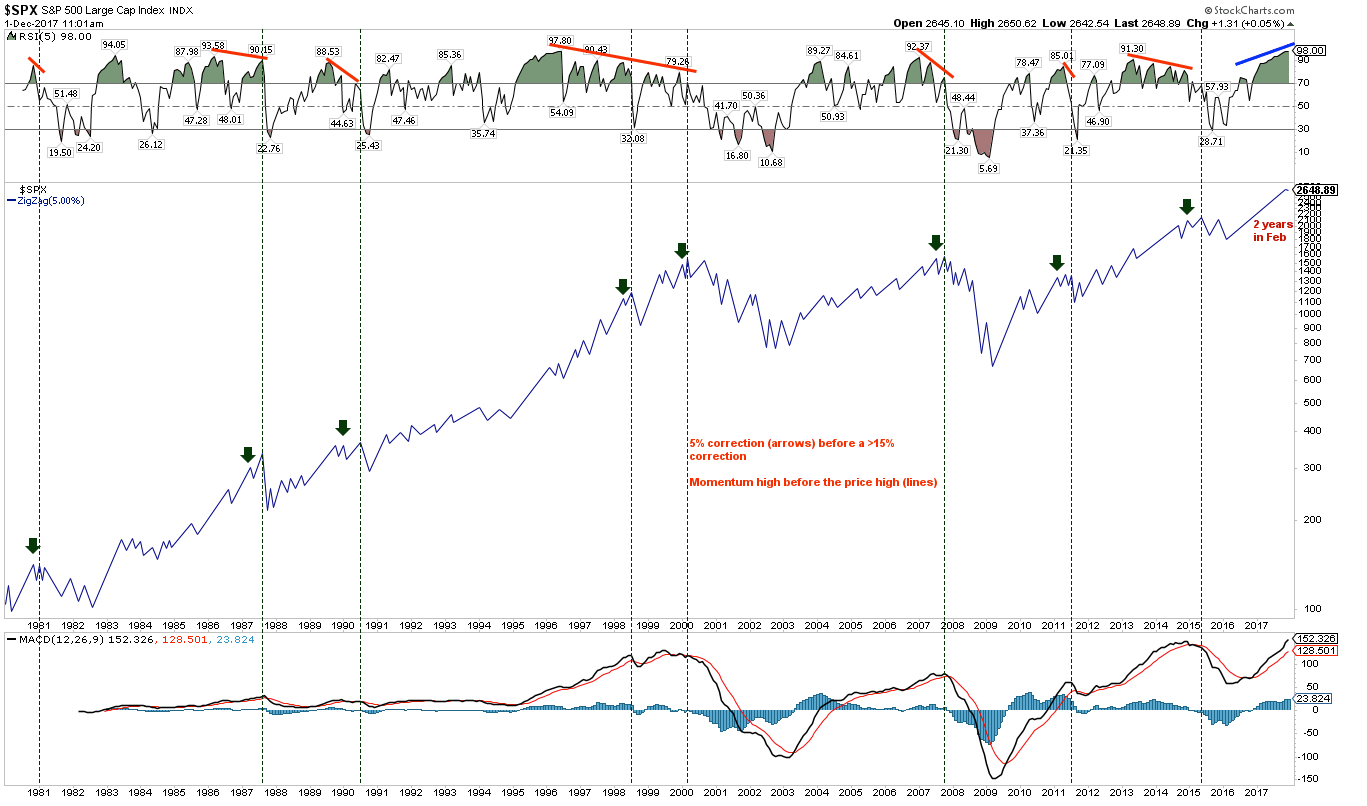
The last correction in SPX greater than 5% was nearly two years ago. In the last 38 years, every correction larger than 15% was preceded by a loss of momentum. This is seen by the index first suffering a 5% correction (arrows) and by RSI diverging lower (lines in the upper panel). Neither of these traits are currently present. In fact, November marked a new momentum high for SPX.
To add more history, let's look at DJIA over the past 100 years. Like SPX, the DJIA is now up 8 months in a row. This has happened 7 times previously; the index was lower the next month in 2 of 7 (29%) - in fact, it has not risen 9 months in a row in 59 years - but higher both 3 and 6 months later in all 7 by a median of 7%. It's not a large sample but the consistency is notable (from Schaeffers).

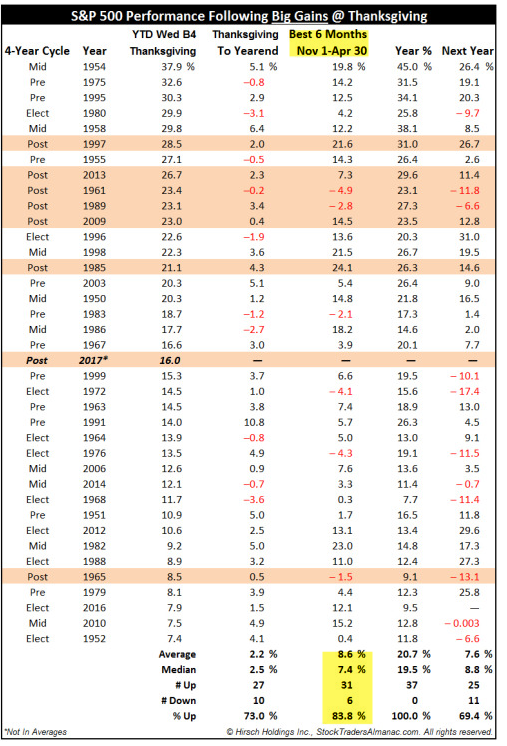
Likewise, when SPX gains more than 7% by Thanksgiving, as it did this year, it has then gained a median of 7.4% during the subsequent "best 6 months of the year" (November thru April) in an astounding 84% of the years since 1950 (from Stock Almanac).
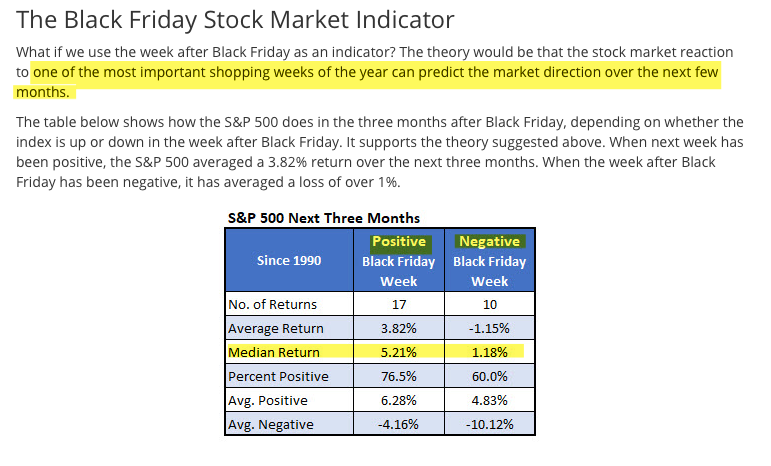
This past week was the first week for holiday shopping, and it tends to be a very good barometer for the months ahead. When this week closes positive (as it did this year), SPX has then gained a median of 5% during the subsequent 3 months in 77% of instances (from Schaeffers).
In short, the US market's strong momentum is unlikely to end abruptly. Any surprising interim weakness (which is always possible; see below), is likely to be a buying opportunity. The first sign of weakness usually is.
The US equity market continues to be underpinned by robust macro economic data that suggests an economic contraction is unlikely within the next 6-12 months.
In October, new home sales reached a new 10 year high, rising 19% yoy. In the past 50 years, the cycle high print has preceded the next recession by more than 12 months. This suggests the current expansion will continue deep into 2018.

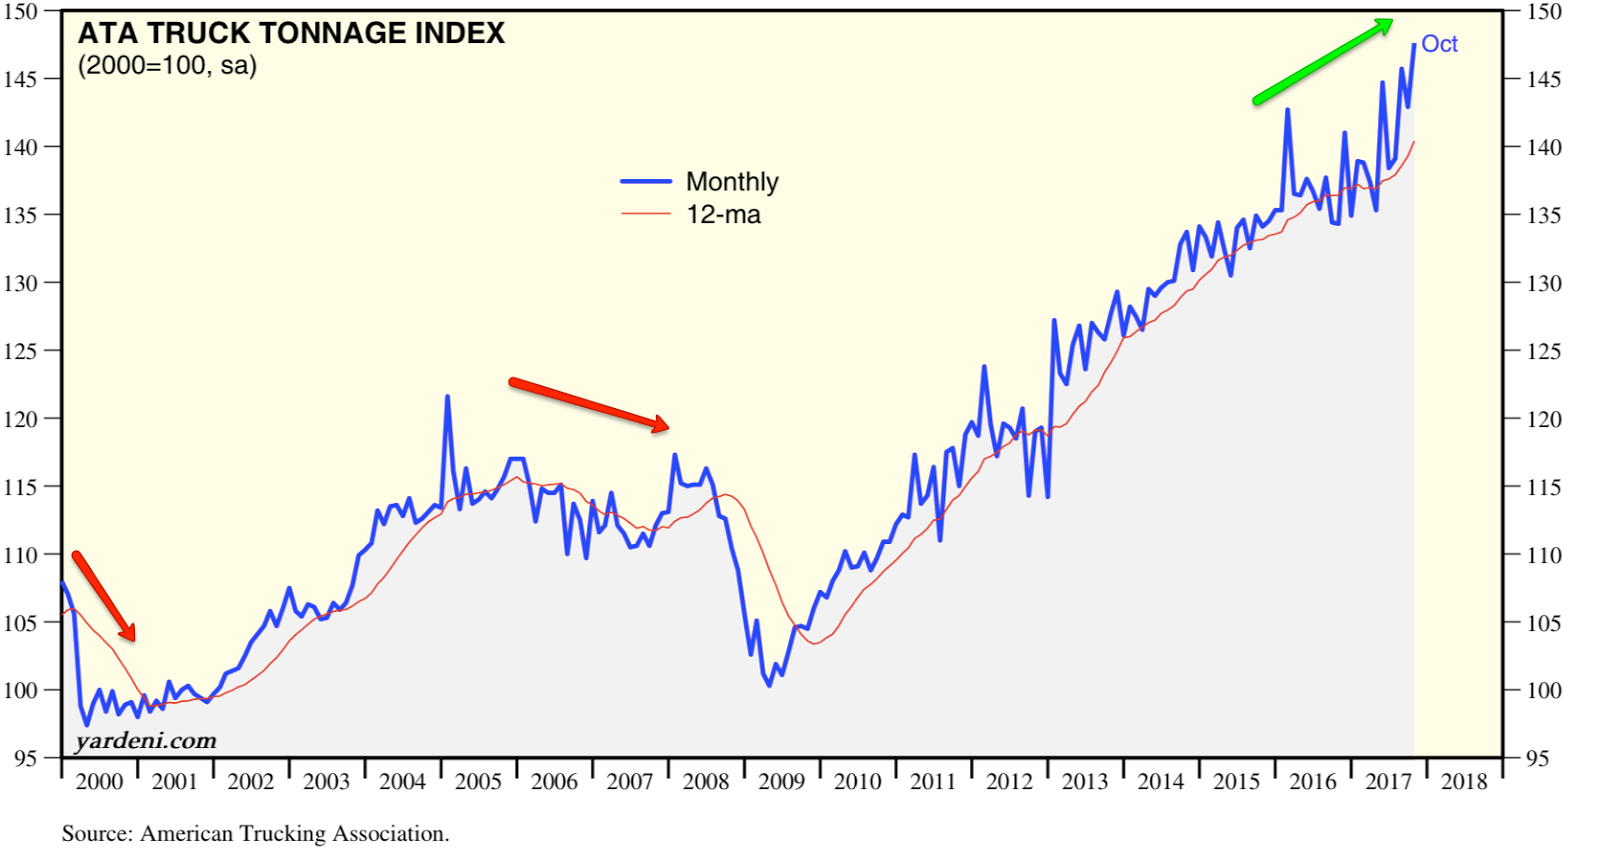
Similarly, truck tonnage increased 10% yoy in October and is higher YTD by 3%. Trucks account for about 70% of the tonnage of goods of all carriers, so this is a useful indicator of the broader economy (from Yardeni).
This is consistent with other economic data in the past month:
Core durable goods order rose 8.5% yoy, the highest rate in 3 years.
Manufacturing industrial production rose 2.7% yoy, the highest growth rate in more than 3 years.
Real retail sales rose 2.5% yoy to a new ATH.
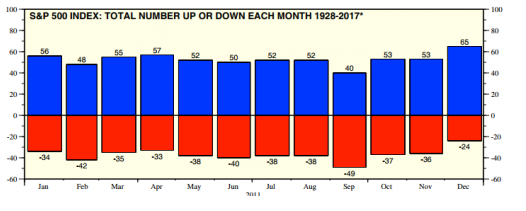
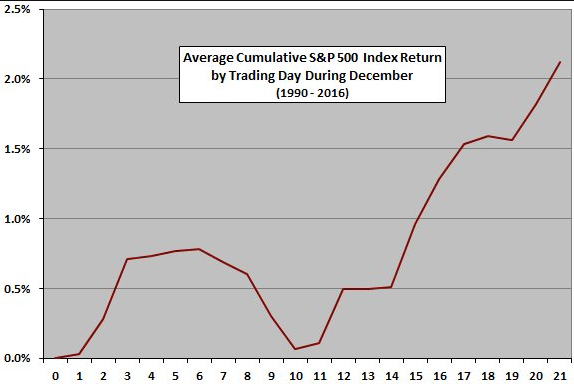
The market is now entering the final month of the year. Seasonality in December is historically the strongest of the year. Since 1928, SPX has closed with a gain in December 73% of the time, the highest win rate of any month of the year (from Yardeni).
Gains in December have averaged 1.6%, the highest of any month in the past 35 years (the next 3 charts from Bianco).

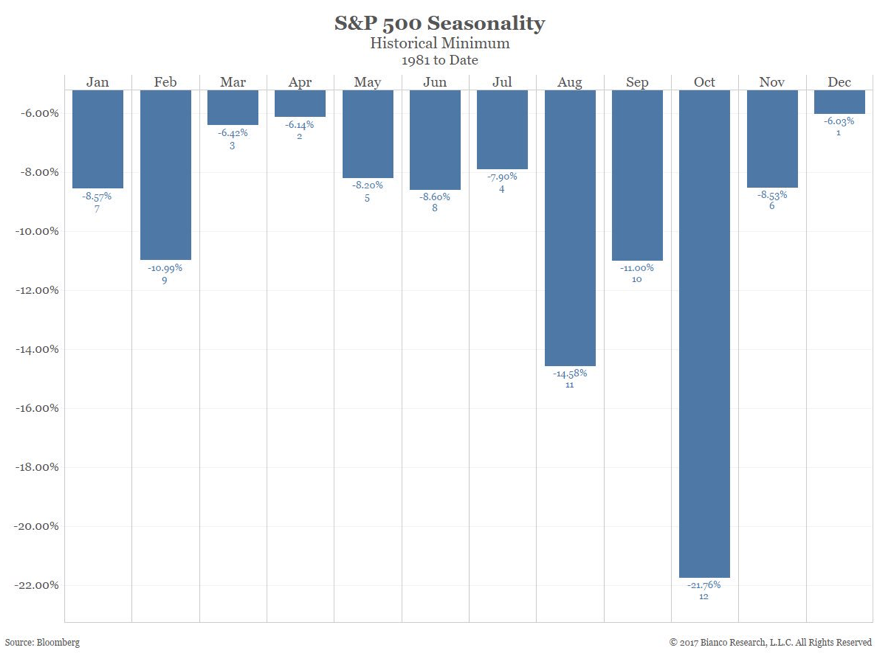
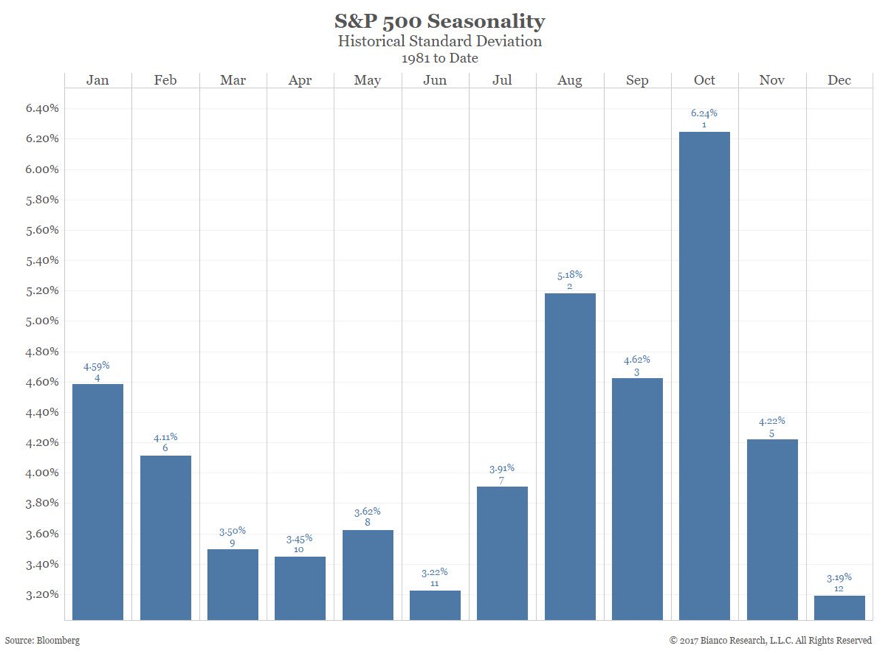
December is also the month with the smallest maximum drawdown and...
... has the lowest volatility of any month.
In the past 90 years, December has never been the SPX's worst month of the year. This bodes well for SPX through the year-end, as the worst month so far this year was a loss of just 0.04% in March (from David Wilson).

If SPX makes a new high this December, forward returns are likely to be good. December is the month least likely to produce a 3 month top. It is also one of the least likely months to produce a 12 month top. That means a new high in December is likely to be followed a higher high in the months ahead (from Dana Lyons).

All of the above being said, it is probably accurate to say that investors are feeling a bit too complacent as December begins. More gains, low drawdowns and low volatility don't imply that stocks will necessarily roll smoothly upwards this December.
In the past 10 years (since 2005, excluding the aberrant bear market during 2007-08), the median drawdown in December has been 2%. Since 2011, drawdowns in SPX have been -4.6%, -3.1%, -2.0%, -5.0%, -4.7% and -1.1%, respectively. Even in December during a bull market, drawdowns that would now feel enormous have recently occurred.
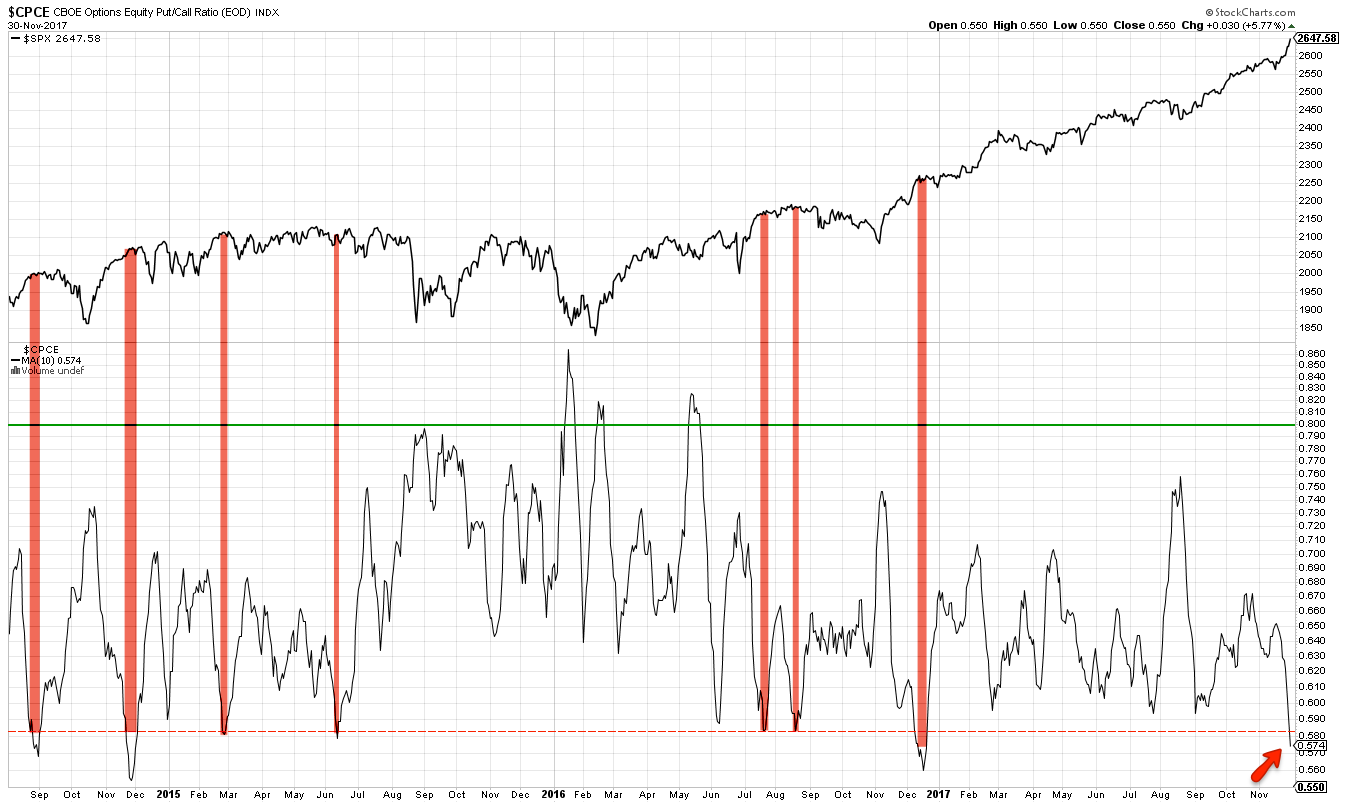
Investor complacency can be best seen in the equity put/call ratios. The 10-day ratio reached a 1 year low this week. That level has preceded drops in the SPX of 100-150 points in the past several years. The last instance, in December 2016, preceded a 1.5% fall that month and a flat period that lasted into late January. Generally, upside has been limited under these conditions.
Likewise, the one-month (weighted) ratio has fallen to the lowest level in more than 5 years. Under similar circumstances, drawdowns in the past year have been minor but in January 2014, SPX lost 6% within a month and in December 2014, SPX lost 5% (from McMillan).

Using the backtest engine from Sentimentrader, similar instances in the past 5 years for the unweighted one-month equity put/call ratio has preceded poor (low or negative) forward returns 15 of 16 times (94%). Any immediate upside is likely to be given back. (If you wish to become a Sentimentrader subscriber, please use this link which results in a small contribution to the Fat Pitch).
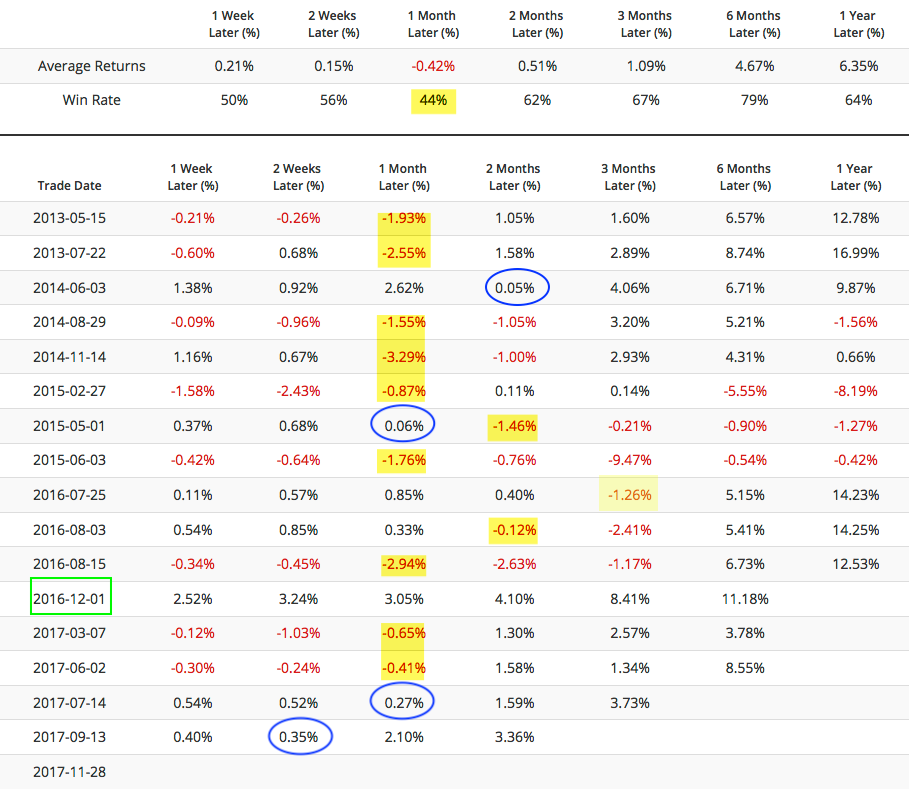
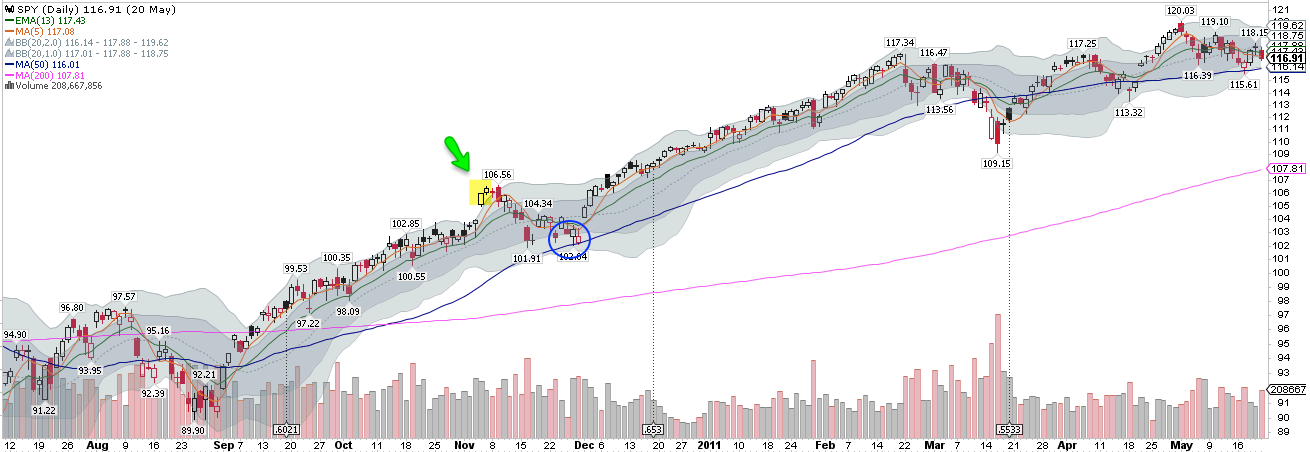
Investor optimism surged as all the US indices together made new ATHs on Tuesday. The gain was so strong that SPX closed 25% above its Bollinger Band width. This is rare. There have been only 6 similar instances in the past 15 years. None marked an exact short-term top in the market, but all preceded a fairly significant drawdown in the week(s) ahead. Risk-reward over this period was very poor. A new post on this is here. The three most recent instances, from 2011-13, are shown below.


On Friday, SPY opened and closed above its upper Bollinger Band for a third day in a row. In the past 20 years, this has happened just once before (in 2010, shown below). Prior instances where this happened twice in a row and when SPY was not breaking out of a prolonged base mostly have the same pattern as those shown above: through price and time, SPY moved towards its 50-d in the next month or so (all of these instances shown in an addendum to this post here).
It's also possible that news regarding Robert Mueller's investigation of the Trump campaign could catalyze a fall. On Friday, SPX fell 1.7% within a half hour after it was announced that former NSA chief Michael Flynn had reached a plea bargain with Mueller.
With these events swirling around, it is notable that the volatility index, VIX, has been rising with SPX. These two normally move opposite each other. When they become correlated, SPX has subsequently underperformed. Their 5-day correlation exceeded 0.9 this week. Under similar circumstances, median returns were negative the next two weeks (blue box) and risk/reward was 3:1 negative in the next month (green boxes). The minimum drawdown during this period was -0.7% (from @SJD10304).

Like most months, December tends to start strong and turn weak into mid-month. That bodes well for the week ahead. The "Santa Claus rally" tends to happen in the final third of the month (from CXO Advisory).
In summary, all of the US equity indices continue to make new all-time highs. SPX and DJIA have risen 8 months in a row. The current uptrend is extended, and may be getting ready to take a short break, but further gains are likely during the first several months of 2018.
December is typically the strongest month of the year for equities. But as bullish as December tends to be, an intra-month drawdown of 2% has been common, even in recent years. By some measures, investor sentiment is more bullish now than at any other time in more than a year. That could mute returns over the next month or so.
The macro calendar this week is highlighted by the monthly employment report on Friday. Aside from this, expect the market to move on developments with tax reform and Mueller's investigation.
If you find this post to be valuable, consider visiting a few of our sponsors who have offers that might be relevant to you.