The leader, NDX, has fallen into a trading zone; a return to this week's low likely triggers a small correction to price levels from late October. SPX would follow.
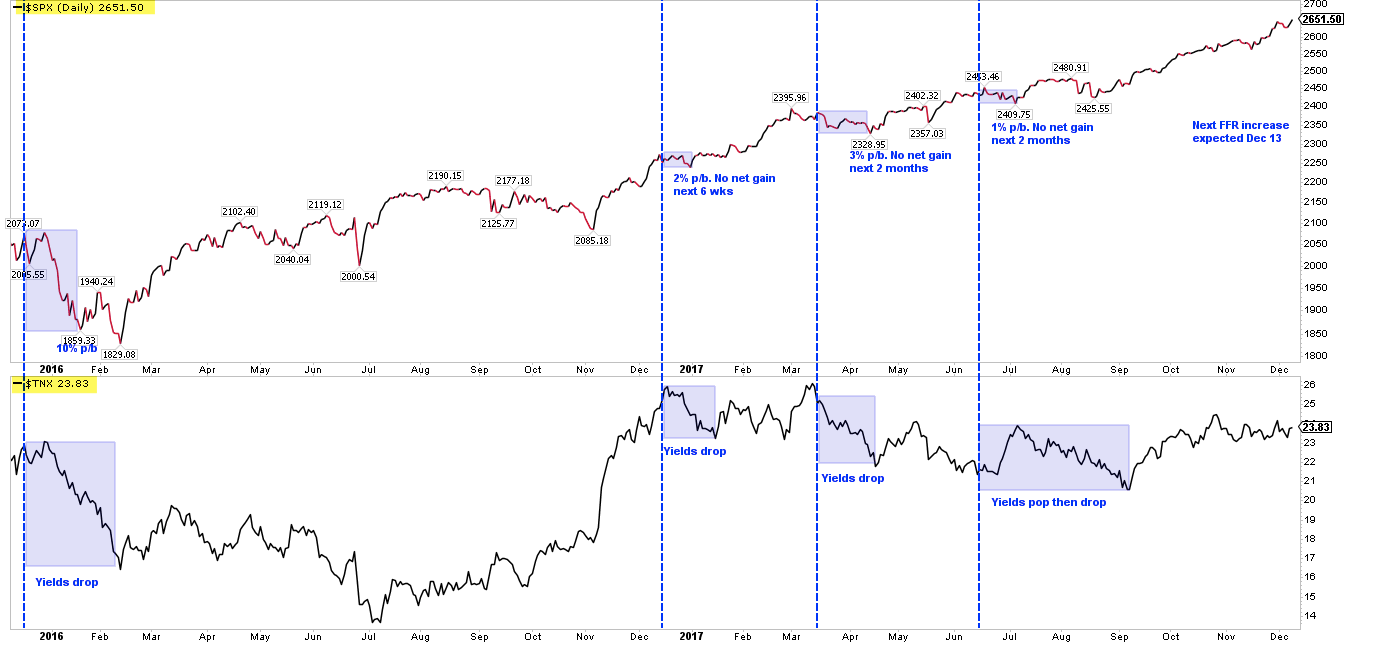
The big event this week is the FOMC meeting on Wednesday, during which a decision to raise the Fed Fund Rate is expected. This would be just the 4th rate increase this economic cycle. Each of the previous events was followed by a pullback in SPX and also a multi-week period where the index did not hold any gains.
* * *
SPX, NYSE and DJIA made new all time highs (ATHs) this week. All made an inter-day ATH on Monday and closed at an ATH on Friday. For Dow Theorists, both the industrial sector and the transport sector also made new ATHs this week. The dominant trend remains higher.
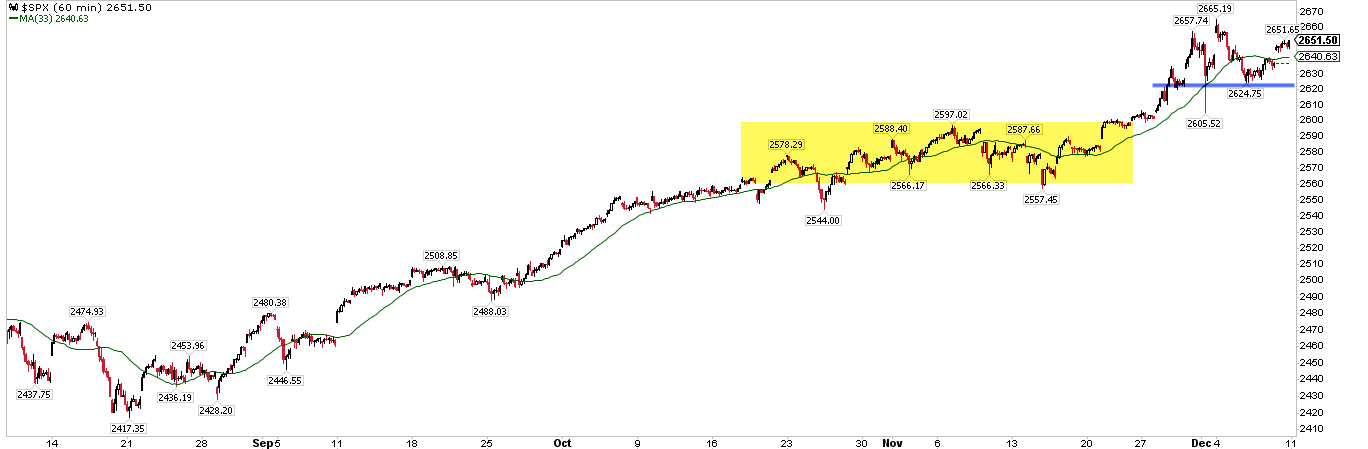
SPX remains above all its moving averages, all of which are rising. This is the definition of an uptrend. It would take a break of 2620 (blue line) to trigger a head and shoulders pattern whose measured move targets the trading zone created over 6 weeks in October-November (yellow shading). Enlarge any chart by clicking on it.
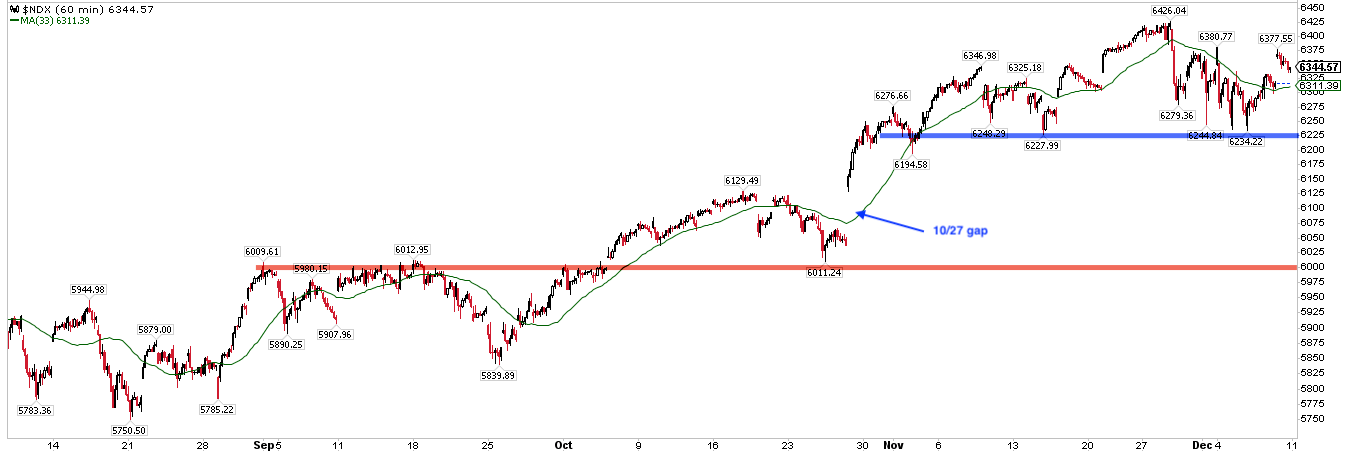
NDX, which has been the markets leader, is now lagging. NDX has fallen into a trading zone that started in late October. A break of 6220 (blue line) likely leads to the large open gap formed on October 27. On an overshoot, the 6000 area (red line) is big support.
The new ATHs in SPX this week are good news longer term. As we showed last week, December is the month least likely to produce a 3 month top and also one of the least likely months to produce a 12 month top. That means that this week's highs is very likely to be followed a higher high in the months ahead. That post is here.
A number of positive studies were presented last week:
NDX recently gained 9 weeks in a row. That level of momentum has not previously marked a significant top: NDX was higher within the next month every time. SPX was likewise higher between 1 and 3 months later every time.
Like SPX, the DJIA is now up 8 months in a row. This has happened 7 times previously in the past 100 years; the index was lower the next month in 2 of 7 (29%) - in fact, it has not risen 9 months in a row in 59 years - but higher both 3 and 6 months later in all 7 by a median of 7%.
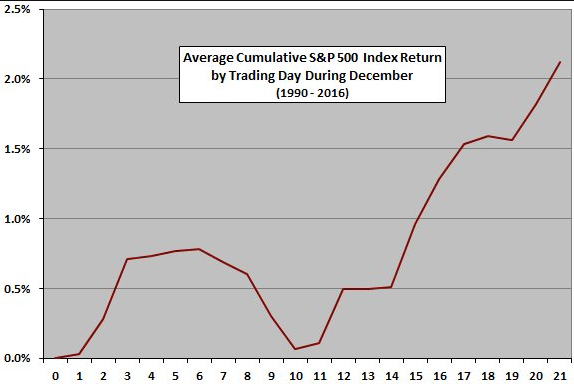
December is the month in which SPX historically has the highest win rate, highest average gain, lowest maximum drawdown and lowest volatility. In the past 90 years, December has never been the SPX's worst month of the year: good news in a year like 2017 where the worst month was a loss of just 0.04%.
And several watch outs for the near term were also presented last week:
In the past 10 years, the median drawdown in December has been 2%, which in today's low volatility environment would seen enormous.
Investors are demonstrably complacent. The 10-day equity put/call ratio has reached a 1 year low, a level that has preceded drops in the SPX of 100-150 points in the past several years. Likewise, the one-month ratio is at a 5 year low.
SPX may be close to an exhaustion high. Various studies using Bollinger Bands triggered; over the past 15-20 years, similar cases have preceded a fairly significant drawdown in the week(s) ahead, during which risk-reward was very poor.
As a supplement to the options data presented above, note that retail investor optimism is now at a bullish extreme. The chart and table below look at small investor opening put/call transactions. This gives a cleaner view of how retail investors are positioned by excluding the hedging transactions of large investors. The current level of call buying has been associated with a lower close in SPX every time over the past 7 years, usually within the next month; the two apparent exceptions are highlighted in green in the chart. (This data is provided by Sentimentrader; if you wish to become a subscriber, please use this link which results in a small contribution to the Fat Pitch).

The most likely potential near term catalyst for equity weakness is the FOMC meeting on Wednesday, during which a decision to raise the Fed Fund Rate is expected. This would be just the 4th rate increase this economic cycle. Each of the previous events was followed by a pullback in SPX and also a multi-week period where the index did not hold any gains. It's a small sample but, like the options data, it suggests that any post-event gains will likely be given back.
Trading is now entering mid-month. Like most months, December tends to start strong and turn weak into mid-month. That bodes poorly for the next two weeks (Monday is Day 6). The "Santa Claus rally" tends to happen in the final third of the month (from CXO Advisory).
To muddy the waters, this week is also options expiration. December OpX week skews positive 71% of the time, although this week has been 50/50 since the 2009 low (from Stock Almanac).

In summary, SPX, NYSE and DJIA made new all-time highs this week. This augurs well for the months ahead. Should NDX return to this week's low, a small correction to price levels from late October likely follows. This week's FOMC meeting is a possible catalyst.
The macro calendar this week is highlighted by the FOMC meeting on Wednesday. CPI is released Wednesday, retail sales on Thursday and industrial production on Friday. Alabama's senatorial election is on Tuesday.
If you find this post to be valuable, consider visiting a few of our sponsors who have offers that might be relevant to you.