While it's true that investors are already bullish and valuations are already high, neither of these implies a likelihood of negative returns in 2018. That the stock market rose strongly this year also has no adverse impact on next year's probable return.
A bear market is always possible, but is also unlikely. That said, the S&P typically experiences a drawdown every year of about 10%; even a 14% fall would be within the normal, annual range. It will feel like the end of the bull market when it happens.
The Fed will likely continue to raise rates next year, which normally leads to higher stock prices. While political risks seem high, the stock market usually ignores these. The "Year 2" presidential cycle provides no investment edge.
This article highlights 11 key ideas to explain what to expect in 2018.
* * *
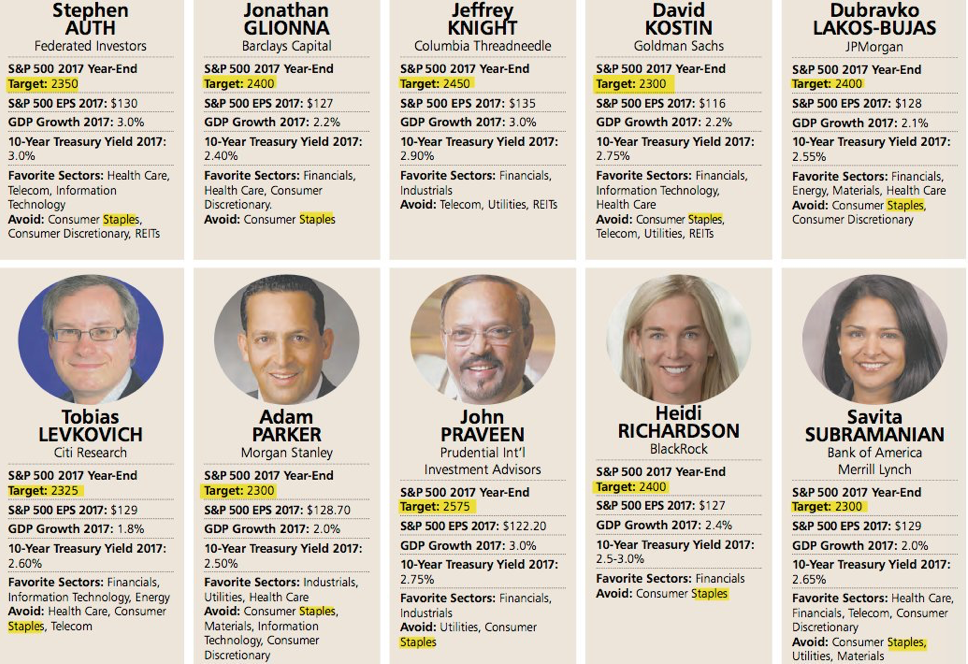
Heading into the end of the year, investment pundits are beginning to share their expectations for how stocks will fare next year. All ten strategists polled by Barron's expect the S&P to rise in 2018, by a mean/median of 6-7% (full article is here; the next three charts from Barron's). Enlarge any image by clicking on it.

It's not a good idea to view these forecasts too precisely. They are rarely so accurate, mostly because data will emerge during the course of the year that forecasters don't have in December when they make their estimates. It's important to realize that strategists provide these forecasts because humans desire certainty. Clients want to know what will happen, even if these guesses are subsequently proven wrong.
Setting rough expectations for the year ahead is appropriate. Even more important is monitoring and adjusting expectations as new data is revealed.
As we look towards 2018, what information is useful and what should be largely ignored in setting expectations for the year ahead? This article highlights 11 key ideas to explain what to expect in 2018.
1. Forget About Precise Price Forecasts
Forecasting where the stock market will finish a year from now is next to impossible. At the end of last year, Wall Street strategists estimated that the S&P would rise to 2380 in 2017, a gain of 5%. That target was reached in February after just 6 weeks. The S&P is now over 2650 and up 17% for the year. Strategists were much too conservative.
In contrast and in hindsight, strategists were absurdly optimistic about 2008. The S&P was heading into its worst year in many generations yet all expected a positive return with an average expected gain of 10%. Instead, stocks fell almost 40%.

Before laughing at how bad these forecasts were, recall that strategists were hardly alone. Professional fund managers, responsible for managing more than $600b in assets, were more than 40% overweight equities in October 2007. Bullish newsletter writers polled by Investors Intelligence outnumbered bears by more than 3 to 1.
The reality is that very few correctly anticipated what would happen in 2008; if they did, it was mostly by luck as proven by the fact that almost all of these pundits have been wrong in expecting a repeat collapse the past several years.
To understand why more precise forecasting of the S&P is so difficult, consider the following:
Over the past 38 years, the S&P has typically gained 10% per year. This is the average.
But the standard deviation from this average is 16%. The standard deviation measures how much any single year typically varies from the average. In other words, it would be normal for the S&P to return anywhere between a loss of 6% to a gain of 26% in any one year. That range captures about 70% of the annual returns since 1980.
The problem is not extreme outliers. The S&P fell 38% in 2008 and 23% in 2002, its two worst years since 1980. At the other end of the spectrum, the S&P gained 35% in 1995 and 31% in 1997, its two best years. There's more than a 60 percentage point difference between the annual returns of the best and worst four years. But even if these extremes are ignored, the standard deviation for the remaining years is a still substantial 11%. This implies a typical year could return anywhere between 0% and 22%.
Even if you exclude all years in which the S&P fell, the standard deviation for all of the positive years is 10%, implying a return anywhere between 6% to 26%.
What all of this means is that getting very precise about where the stock market will end a year from now is an exercise in futility. The probability of getting it consistently right - even within 5 to 10 percentage points - is poor.
Further reading: Everyone Is Bad At This (here).
2. Where To Start: Equities Have A Strong Upward Bias
Just because precise forecasts are impractical doesn't mean we should have no idea what will likely happen to stocks over the next year. There are certain assumptions we can make that can inform our decision making and our expectations. We can use this as a starting point in making investments and adjust as new information becomes available.
The most important fact to always remember is this: stocks in the US have high propensity to rise each year. The S&P has risen in 79% of the years since 1980, and in 72% of the years since 1950. In other words, the long-term historical odds of stocks rising next year are about 2 to 3 times greater than for stocks falling. Equities are fundamentally biased upwards over time.
Why do strategists expect equities to rise every year? Because they usually do.
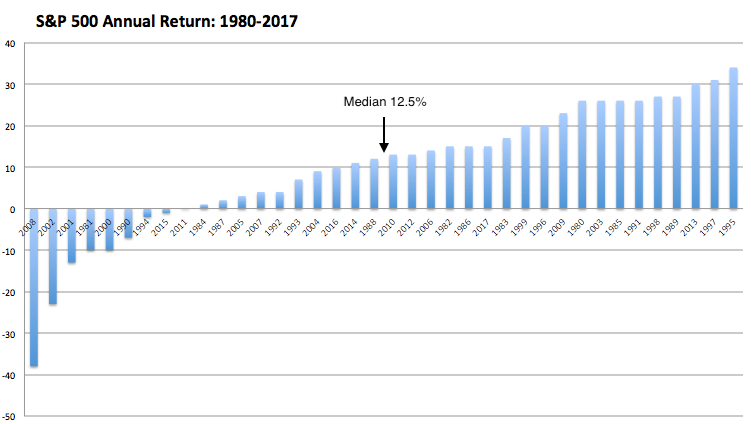
The median annual return in the past 40 years as well as in the last 70 years is the same, about 12%. Using the median avoids the impact that a few outliers can have on the average.
Expecting the index to fall by a large amount in the next year is almost always a poor bet. While the standard deviation for the S&P's returns may be wide, the index has suffered an annual loss of less than 3% an overwhelming 84% of the time since 1980. In the past 193 years, US equities have suffered an annual loss greater than 20% just 9 times, a frequency of just 4.7%. That is the historical probability of equities ending next year in a bear market (from basehitinvesting.com).

So, if you knew nothing about the stock market, you would bet that stocks are very likely to rise next year and are very unlikely to end the year substantially lower. This is known as the "base rate," the probability you would assign to an outcome if you knew nothing other than how often it was statistically likely to happen.
Further reading: Following The Stock Market Is Bad For Your Returns (here).
3. A 10% Intra-year Fall Is Odds On
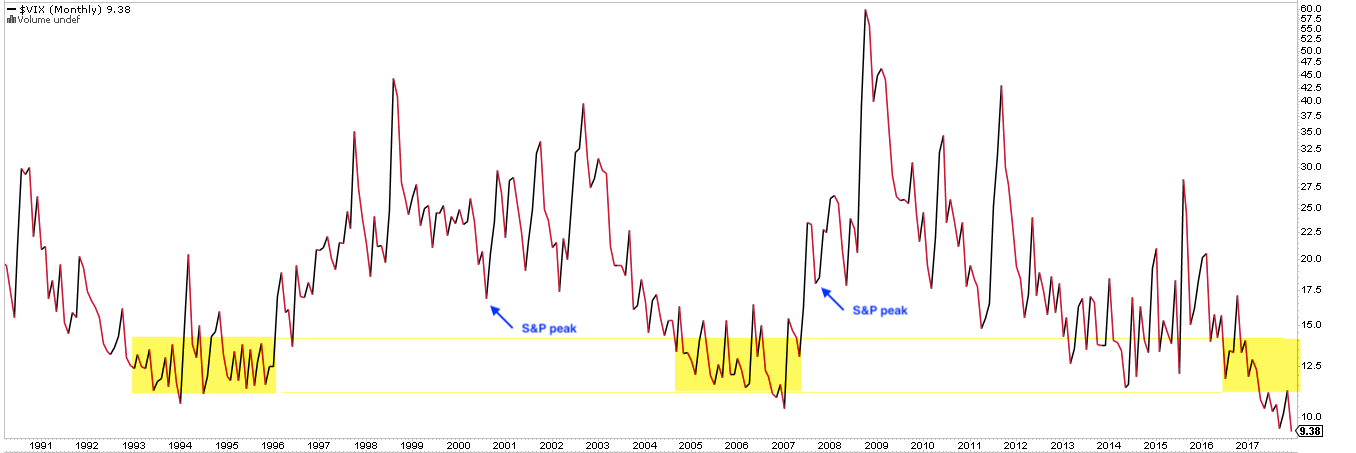
It's likely that the low volatility environment that has prevailed over the past year is making investors feel a bit too complacent. That's unfortunate. While equities have a strong propensity to rise each year, they rarely do so in so straight a line as in 2017. That is an outlier, happening only once previously in the past 38 years (1995).
On average, the S&P experiences a drawdown every year of about 10%. At this point, that would feel enormous, it would feel like the end of the bull market, but it is simply the norm.

Even if you exclude the bear market years (on the left side of the chart above), the median drawdown is still 9%. With a standard deviation of 5%, a drawdown as big as 14% is within the normal range. Every investor should expect something like this to occur annually, including in 2018.
That doesn't mean the current period of low volatility will abruptly end. Similar periods in the 1990s and 2000s lasted 2-3 years. Volatility fell through the floor in 2017 and it would be reasonable to expect it to periodically spike higher in 2018 (as it did during similar periods highlighted below). The last two bear markets started well after the period of low volatility had clearly ended.
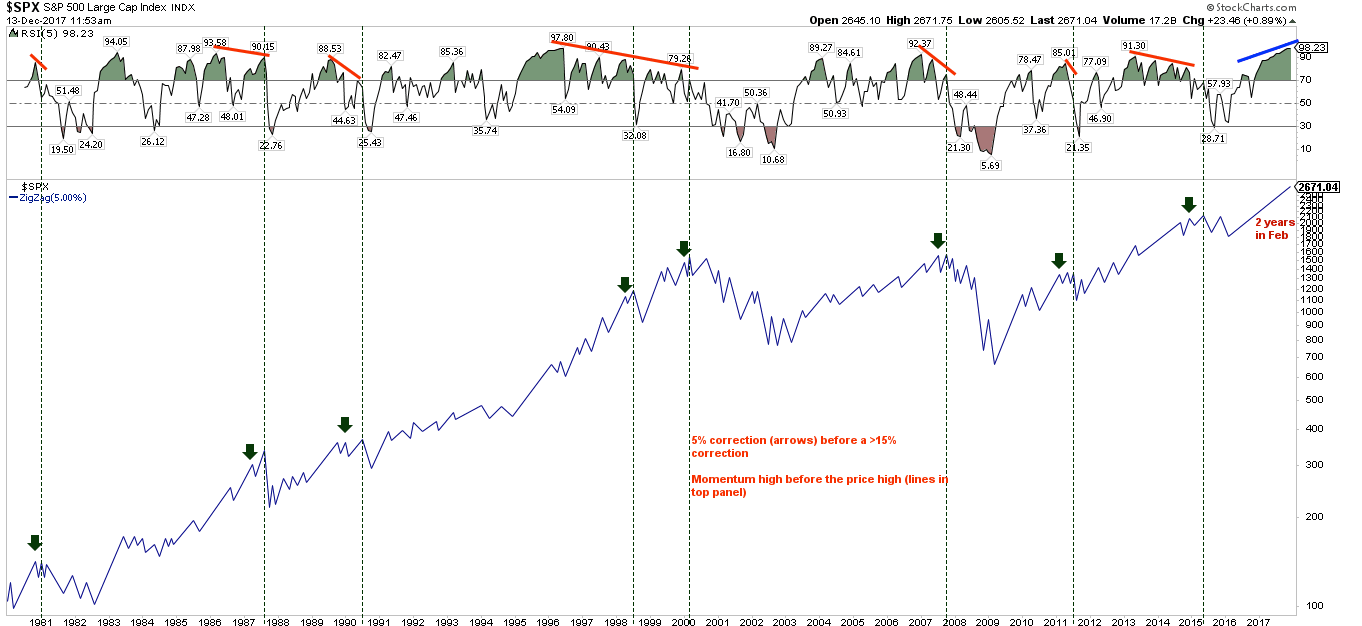
The last correction in the S&P greater than 5% was nearly two years ago. Long uptrends like this rarely reverse abruptly. They weaken first. In the last 38 years, every correction larger than 15% was preceded by a loss of momentum, as seen by the index first suffering a 5% correction and then retesting its prior high. The sawtooth pattern seen at tops is typically accompanied by a rise in volatility. This should be an early indication that the uptrend may be ending.
4. What Stocks Did This Year Doesn't Matter For Next Year
You might guess that next year's return depends on what happened this year: a large gain might likely be followed by a smaller gain, or a fall might more likely be followed by rebound higher. But this doesn't matter.
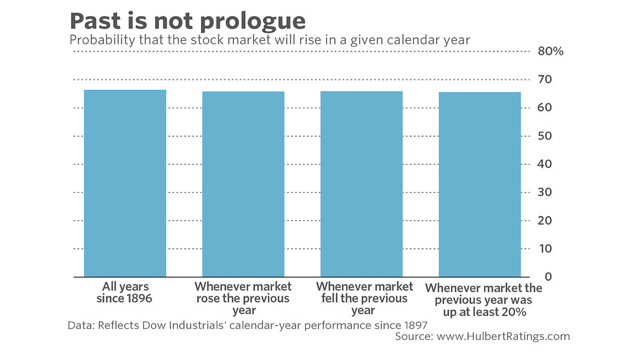
Data over the past 120 years shows that whatever happens in one year has very little impact on returns or probabilities the following year. If stocks gain over 20% this year, their return next year is not much different than if the market had fallen this year (right column). Moreover, the odds of stocks rising next year is the same regardless (second chart; both from Mark Hulbert).
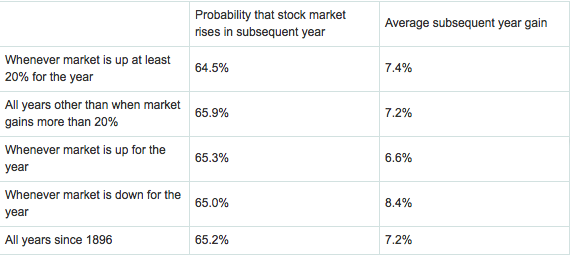
Just because 2017 was a big up year doesn't mean stocks will rise less next year. It certainly doesn't mean that stocks will fall. The odds are still biased towards further gains.
5. Valuations Matter, But Not Over The Next 12-Months
But, you say, stocks are now so expensive. They can't rise next year. Actually, they can.
Valuations have little predictive value on next year's return. The correlation coefficient is just 10%, meaning 90% of next year's return is explained by factors other than valuation (left side of the chart). So, while current valuations are high by almost any measure, this has historically had little impact on how stocks faired the following year (from JPM).

Often, bull markets end with a period of investor exuberance, during which time valuations spike even higher. If the stock market is in its final inning, that could be on deck for 2018.
It is, however, very true that over longer periods of time, higher valuations statistically presage lower future returns (right side in the chart above). Investors should reset their expectations about annual gains to be much lower over the next several years than what they have recently experienced.
Further reading: When 'Buy and Hold' Works, And When It Doesn't (here).
6. Bullish Sentiment Lowers Returns, But They're Still Positive
After an 8 year bull market and a 26% return in the past 13 months, it should surprise no one that investors are now leaning bullish. To be clear, the data on sentiment is mixed. Investors Intelligence (newsletter writers) and options data suggest investors are very bullish; AAII (retail investors) and fund managers surveyed by BAML are neutral (more on fund mangers' current asset allocation here).
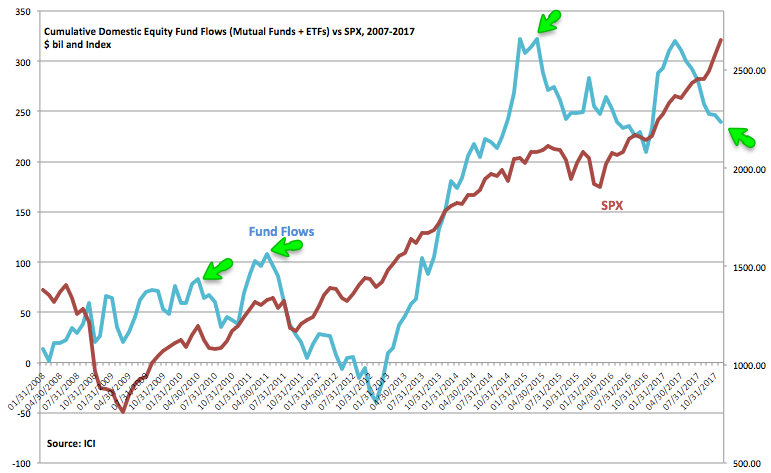
Fund flow data indicates that investors in the US are not at all bullish: domestic equity ETFs and mutual funds have had outflows for 8 months in a row (blue line). Notable peaks in the S&P (red line) in 2010, 2011 and 2015 were accompanied by fund outflows (arrows); this time, investors seem to be selling these funds as price rises. That is not the typical behavior of indiscriminate bulls (from ICI).
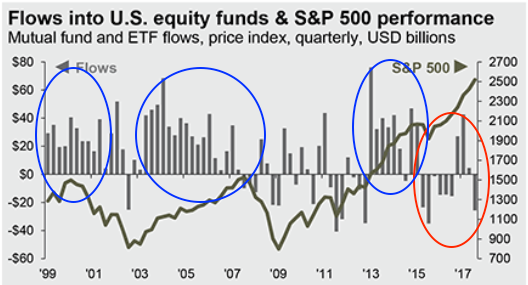
Equity peaks in 2000 and 2007 were likewise accompanied by persistent equity fund inflows (blue circles), a situation very unlike today's as equities have experienced outflows in 7 of the past 10 quarters (red circle; from JPM).
Let's go with the consensus and assume that Investors Intelligence is the most accurate measurement of current sentiment. Bulls have outnumbered bears in this survey by more than 4:1 since the start of October. The conventional wisdom is that stocks should decline under these circumstances; instead, the S&P has gained nearly 5%.
That result is not an outlier. In the past 48 years, when these investors have been very bullish (like now), the S&P has risen further in the next year 71% of the time by an average of 7%. Returns are positive, although less so than when these investors are less bullish (from Pension Partners; read further here).
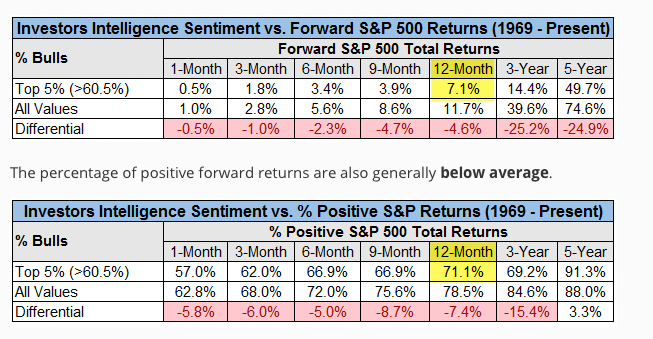
The best returns, of course, occur in the year after investors have been bearish. Gains are 2-1/2 times higher.

These statistics are not much different than if data over the past 30 years from AAII is used. When too many investors are bullish, returns in the next year are still positive (red highlights) but about half of those when the starting point is pervasive bearishness (green highlights).

In general, market bottoms tend to be easier to pinpoint than tops. Sharp falls in the index are associated with panic selling. Investors typically become bullish at varying rates but they become bearish all at once. Why? Because the fear of loss is much more powerful than the allure of greed. Humans evolved to protect themselves from harm first.
For this reason, pervasive bearishness is a strong contrarian signal. In these situations, betting on the unexpected (a rise) is typically rewarded with excess returns. But the reverse is not as true: betting on the unexpected (a fall) in an uptrend doesn't work very well. Markets still typically rise, but expected returns and the base rate are lower. Assuming a symmetry in the use of sentiment data is one of the biggest mistakes active investors make and a key reason most perpetually underperform.
The bottomline is if investors are now bullish, we should expect lower than average returns next year (mid-single digits). But expecting a large, sustained fall in the absence of other compelling, confirmative data is likely to be a bad bet.
Further reading:
Households' Equity Ownership Reaches 30%. It's Statistical Noise (here).
This Is What A Bubble Looks Like (here).
7. Bear Markets Usually Only Happen During A Recession
An example of such compelling, confirmative data would be macro-economic. If the trend in growth were showing weaknesses, then excessive bullishness would be a valid reason to expect downside in equities next year.
Why? Because bear markets rarely take place outside of an economic recession. In the post-World War II era, there have been 10 bear markets, only two of which have occurred outside of a recession. The first (1966) occurred amid rapidly rising interest rates (from 4% to 6%) and spiraling inflation. The second (1987) occurred after a euphoric 50% rise in equities over a 10-month period. At present, the current market and economic environment is unlike either of these situations.

In the past month, new home sales reached a new 10 year high, real retail sales reached a new all-time high, unemployment claims reached a new 45 year low and US manufacturing growth reached a new 3+ year high. On balance, the risk of a recession in 2018 is low, although monitoring incoming data is essential (updated monthly here).
Consumers account for about 70% of the US economy, so household finances are an important determinant of economic growth. Rising wages and employment are boosting aggregate income. While household debt has risen, assets have risen even further (bottom right). The relative indebtedness of households has rarely been lower in the past 30 years. Even if you exclude the rise in asset values since 2009, households own assets worth about 4.6 times more than their debts (left side); that is a very healthy coverage ratio (from JPM).

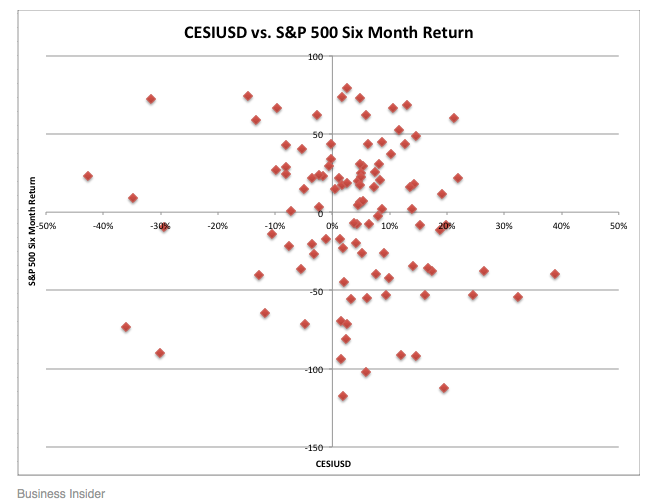
Economic data is ending 2017 strong. The Citigroup Economic Surprise Index is at a 4-year high. It would not be surprising if data in the first half of 2018 disappointed. That is a typical annual pattern. But even over the next 6 months, the extent to which economic data exceeds or disappoints the consensus has no bearing on equity returns (from Business Insider).
Further reading:
Housing and Manufacturing Growth At Multi-Year Highs (here).
Forecasting The Next Recession Based On The Calendar And The Presidency (here).
Has US Debt Reached A Tipping Point? (here).
Recessions And Bear Markets (here).
8. Earnings Growth Implies ~6% Price Appreciation, But It Could Be 13% With Tax Cuts
Earnings growth next year is expected to be around 10%. That growth in unlikely to be achieved. In the past 20 years, analysts have overestimated earnings growth 15 times (75%) by an average of 9%. If you exclude some major outliers (2001, 2008 and 2009), the average is still an overestimation of 4%. If 2018 is average, earnings will grow about 6% (from FactSet; read more here).
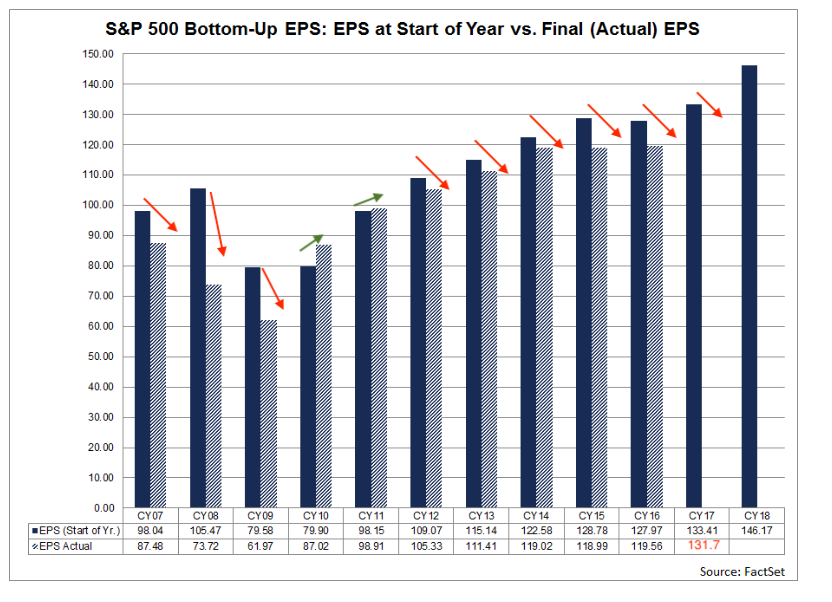
For reference, 2017 is now expected to have earnings growth of 9% on sales growth of 6%. Analysts' forecasts this year were very accurate: the overestimation from the start of the year is only about 1%.
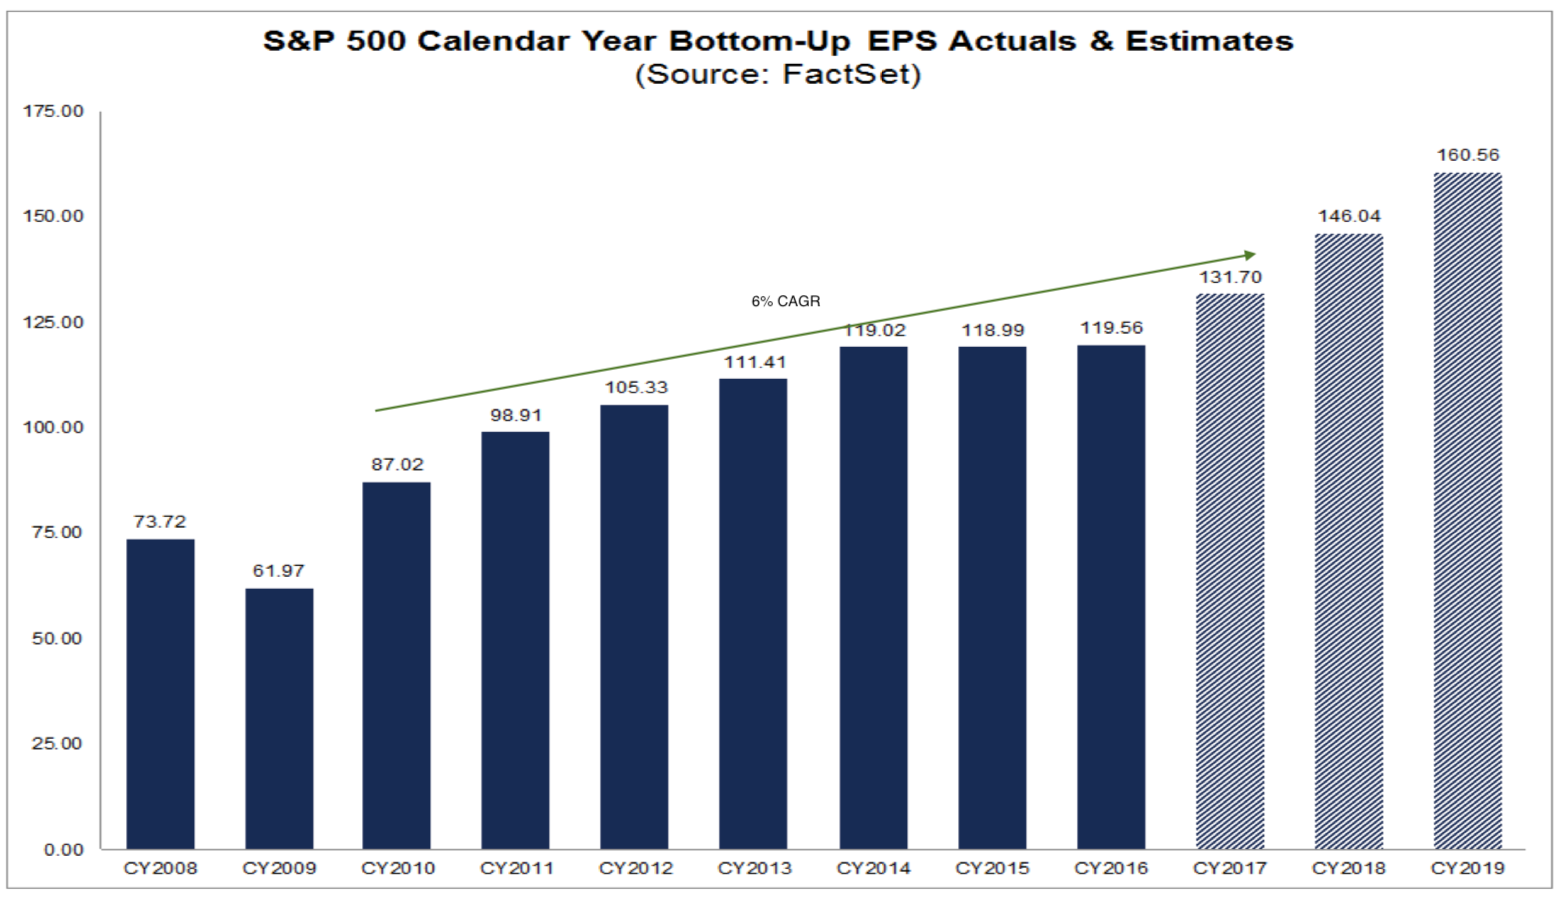
And for further reference, the annual growth in earnings over the past 7 years has been 6% (compounded). As a rough estimate for next year, 6% is reasonable.
6% earnings growth is roughly inline with economic and consumption growth of 4.5% (nominal) in the US. In the past 3 years, the price of oil and the value of the dollar have had a material impact on corporate profits. Right now, these appear to be tailwinds for earnings in 2018, but their variability means making more exact growth forecasts is difficult and prone to error. Read more about this here (from JPM).
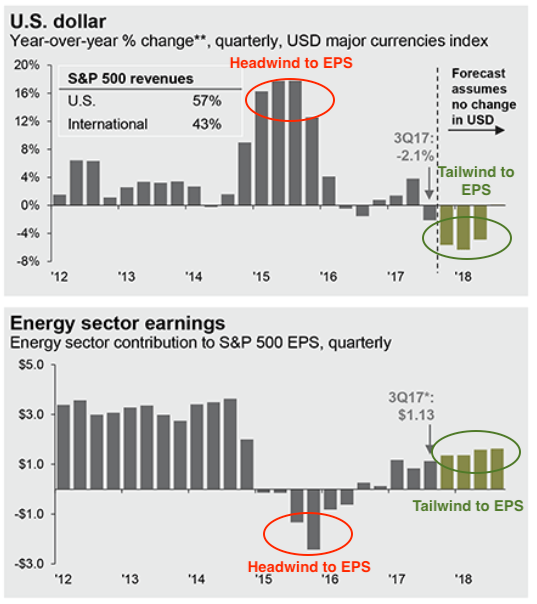
A big wild card right now is corporate tax cuts. Analysts estimate that these could add $10 to next year's earnings, meaning earnings growth could jump from 6% to 13%. How much of this is already "priced in" is anyone's guess. A conservative assumption would be that most of it has been priced in.
These tax cuts will not materially raise longer-term growth forecasts. US corporations are not capital constrained; they have abundant cash and access to low cost debt and equity. Moreover, corporations have been making fixed capital investments and have ample slack capacity (utilization is only 77%). Over the past 3 decades, rising corporate profitability (blue line) has had no positive affect on new investments (red line; from the FT).

The bottomline is this: with earnings growth of about 6%, it will probably take a further expansion in valuations to drive market appreciation at a higher rate in 2018. That's always possible, but it does imply that already bullish sentiment needs to become even more so (similar to 1997-2000). Based on corporate fundamentals, a reasonable baseline would be to expect mid-single digit price appreciation for the S&P in 2018 (from Yardeni).

Further reading:
Solid Sales Growth and Margins At New Highs Drive 3Q17 Results (here).
Technology, Not Trade or Regulations, Killed Manufacturing Jobs (here).
9. Rising Rates
The Federal Reserve has raised its guidance rate (the federal funds rate, FFR) 5 times since December 2015. It is expected to continue raising rates in 2018, although this is contingent upon incoming inflation and employment data.
Equity prices usually rise with rates. Why? Because rising rates imply continued economic growth: better incomes lead to more consumption which eventually leads to increased investment. Higher tax revenues also allow the government sector to spend. This is a virtuous cycle that raises corporate profits, consumer confidence and the stock market.
In fact, in the past 70 years, there have been 12 discrete tightening periods during which the S&P has risen 83% of the time by a mean/median of 9-10% per annum. The only two losing periods included the 1973 oil embargo and the 1987 crash (from NDR).
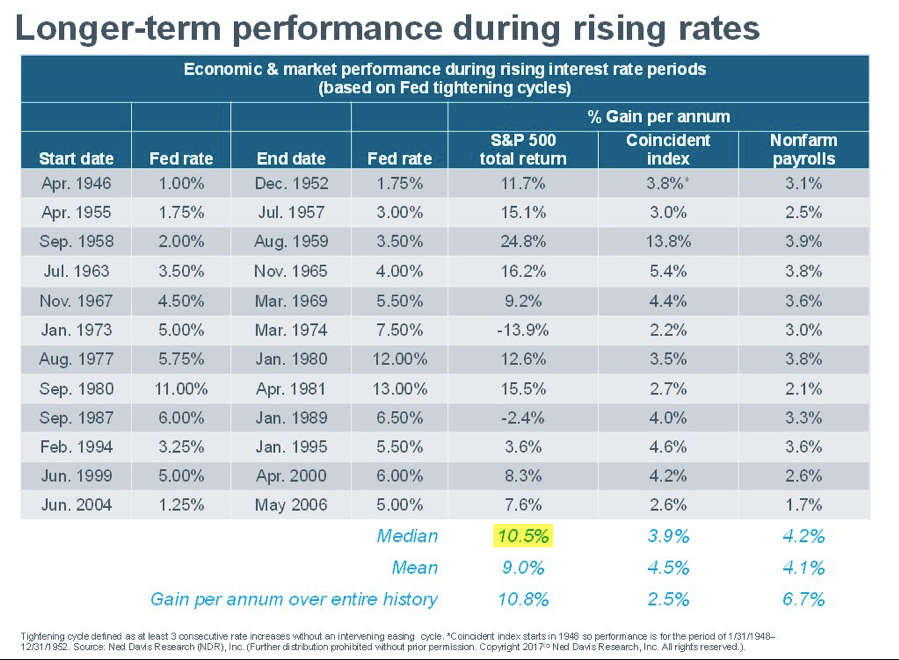
In particular, in the past 54 years, when rates have risen from a low baseline (like today; yellow shading), the S&P has continued to rise on a two year rolling basis (from JPM).

In the prior cycle, the Fed raised rates 17 times between June 2004 and June 2006. The S&P did not peak until 15 months after the last hike.
It's important to put the current FFR in context. There is very little risk that upcoming FFR hikes are likely to choke the economy's expansion. In the past 60 years, the lowest effective FFR which has coincided with the start of a recession is 3%. The current rate is 1.4%.
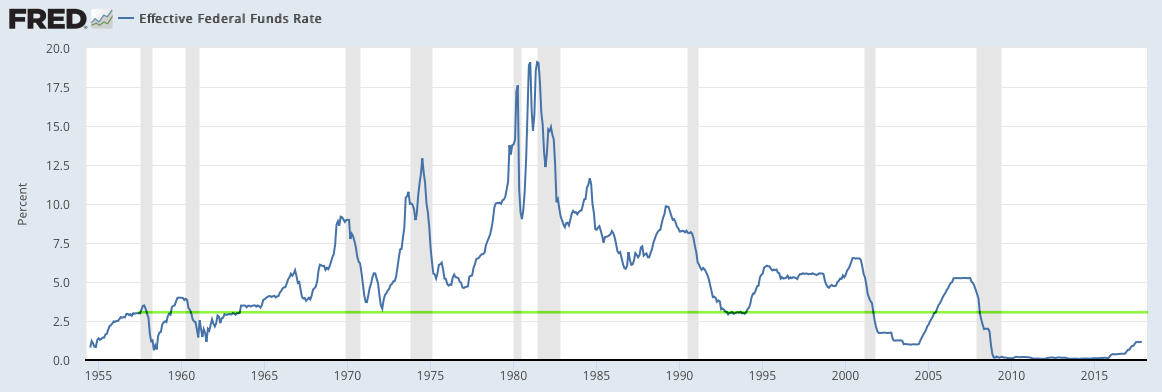
So long as the pace of rate increases is moderate (e.g., unlike 1966), higher interest rates should not be a negative factor in 2018.
Further reading:
The End of QE Didn't Kill The Bull Market. The Start of QT Won't Either (here).
The Flattening Yield Curve Is Not A Threat to US Equities (here).
Path To Higher Yields In 2018 Unlikely To Be Straight Forward (here).
10. Seasonal Cycle Provides No Investment Edge
2018 is the second year of the 4 year 'Presidential Cycle.' On average, these years have lower returns than other years, gaining 4% versus 7% for all years (from Hulbert).
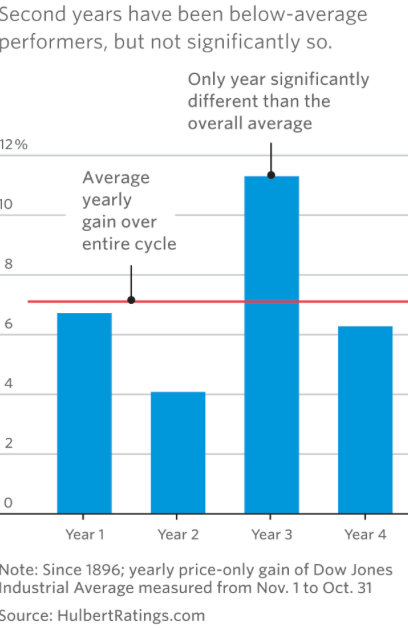
The theory behind this cycle is that presidents goose the economy into each election and Year 2 is thus the cycle low point between these efforts. However, as the chart title above notes, Year 2's lower return is not statistically significant. That is easily seen when looking at the past nine cycles: Year 2s (highlighted below) have varied between a gain of 27% and a loss of 23%. Separating first terms from second terms doesn't improve the fit (from JPM).

There is too much variability to rely upon this cycle giving an investment edge in 2018.
Should you be tempted to believe that years ending in the number '8' imply a probabilistic outcome, the link below will provide useful reading. Years ending in '5' were supposed to be the best of any year yet 2015 closed down 1%. The empirical fallacy of this was easy to identify beforehand (here).
Further reading:
Why Year 3 of the Presidential Cycle Hasn't Gone The Way Everyone Expected (here).
The Bullish "Year 5" Set Up Is Missing A Key Ingredient (here).
11: Politics Is A Stock Market Wild Card
There is always the possibility that all of the above becomes moot and that political events overtake the market in the form of a crisis in the Middle East, the Korean Peninsula, Russia or even in the US (e.g., Trump vs Mueller). This is a wild card, precisely because no one can say when or even if any of this will happen.
However, it is worth noting that political events normally take a backseat to economics. The 1960s and 1970s were the most politically violent period in the post-war era. Disentangling these events from economics is sometimes difficult (i.e., Watergate), but riots and political assassinations (as noted by name) had little lasting affect on the stock market. In comparison, the severe monetary tightening in 1966 and recessions in 1969-70 and 1973-75 each had a very visible and material impact.

It's inarguably true that the low volatility and steady gains of 2017 leave market participants unprepared for a shock or a surprise in 2018. That is all the more reason to be mentally prepared for an intra-year drawdown as large as the annual median of 10%. But it is unlikely that a political event that doesn't impact the economy would lead to a sustained bear market.
Further reading: The Market Shock No One is Ready For (here).
* * *
In summary, this article discussed several key ideas to explain what to expect from equities in 2018. US stocks will likely rise in 2018. Earnings growth, investor sentiment and valuation suggest that mid-single digit appreciation is a reasonable expectation, but the truth is wild cards, especially investor psychology, could push returns much higher (or lower). A bear market is possible, but unlikely. An intra-year drawdown of 10% (even a 14%) is odds-on; it will feel like the end of the bull market when it happens.
Thank you for reading The Fat Pitch in 2017. Enjoy a restful and peaceful holiday.
If you find this post to be valuable, consider visiting a few of our sponsors who have offers that might be relevant to you.