Saturday, January 27, 2018

Weekly Market Summary

Summary:  US equities have already gained more in the first few weeks of January than they do in many full years. The recent trend is being termed unprecedented, but these types of gains have happened before. The current trend is also being called unsustainable, but in most prior cases, equities have continued higher. The equity market is undeniably hot, and that can often lead to a period of retracement and decline, but trends weaken before they reverse, and this one has not shown any sign of weakness. The longer term outlook remains favorable.

* * *

All of the US indices made new all time highs (ATHs) again this week.  This includes the very broad NYSE (composed of 2800 stocks) as well as the small cap index, RUT. The dominant trend remains higher.

US markets have started the year like a rocket. SPX and DJIA are up 7.5% and NDX is up 9.7% YTD (from Alphatrends). Enlarge any chart by clicking on it.


Thursday, January 18, 2018

Fund Managers' Current Asset Allocation - January

Summary: Global equities rose 22% in 2017. Throughout almost that entire period, fund managers held significant amounts of cash and were, at best, only modestly bullish on equities. All of this suggested lingering risk aversion following a recession scare in 2016.

As 2018 begins, cash levels have fallen to the lowest level in 4 years. Allocations to global equities have risen to the highest level in nearly 3 years. In most respects, investors are now bullish.

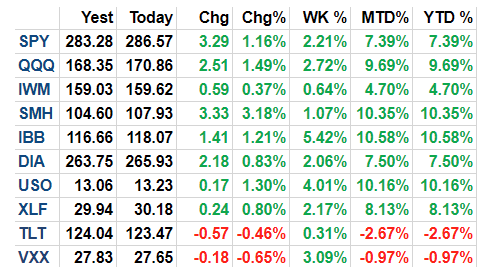
In the past 6 months, US equities have outperformed Europe by 12% and the rest the world by 2%. Despite this, fund managers remain underweight the US. US equities should outperform their global peers.

Fund managers are underweight global bonds by the greatest extent in 4 years. Only 4% of fund managers believe global rates will be lower next year, a level at which yields have often fallen, at least temporarily.

* * *

Among the various ways of measuring investor sentiment, the BAML survey of global fund managers is one of the better as the results reflect how managers are allocated in various asset classes. These managers oversee a combined $600b in assets.

The data should be viewed mostly from a contrarian perspective; that is, when equities fall in price, allocations to cash go higher and allocations to equities go lower as investors become bearish, setting up a buy signal. When prices rise, the opposite occurs, setting up a sell signal. We did a recap of this pattern in December 2014 (post).

Let's review the highlights from the past month.

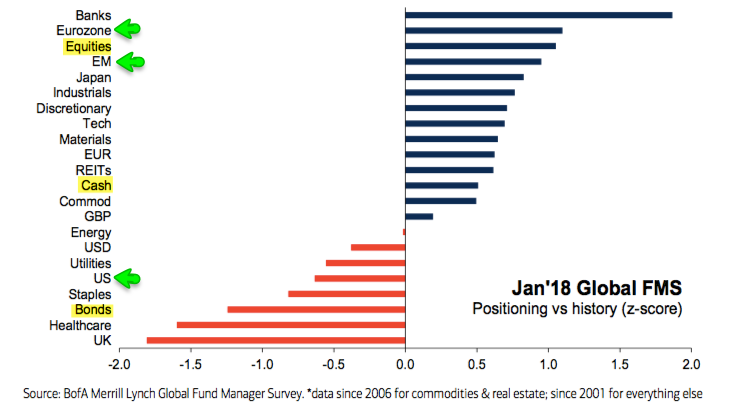
Overall: Relative to history, fund managers are overweight equities and underweight bonds. Cash is neutral. Enlarge any image by clicking on it.
Within equities, the US is significantly underweight while Europe, Japan and emerging markets are all significantly overweight. 
A pure contrarian would overweight US equities relative to Europe, Japan and emerging markets, and overweight global bonds relative to a 60-30-10 basket. 


Saturday, January 13, 2018

Weekly Market Summary

Summary:  All of the US indices made new all-time highs this week. Equities outside the US are performing even better. The dominant trend remains higher, underpinned by strong economic data, earnings that are being revised higher and equity breadth that is expanding.

After just two weeks, the SPX is already within 2% of Wall Street's year-end target. By at least one measure, momentum is at a more than 20 year high: in prior instances, short-term risk/reward has been poor but longer term returns positive. Sentiment, which is exceedingly bullish, has also most often led to positive returns 3-6 months later. Net, the longer-term outlook for equities remains favorable.

* * *

All of the US indices made new all time highs (ATHs) this week.  This includes the very broad NYSE as well as the small cap index, RUT. For Dow Theorists, both the industrial sector and the transport sector made new ATHs this week. The dominant trend remains higher.

US markets are off to a fast start in 2018. SPX and DJIA are up 4% and NDX is up 5.5% (from Alphatrends). Enlarge any chart by clicking on it.


Friday, January 5, 2018

January Macro Update: Home Sales, Retail Sales and Manufacturing Surge Higher

SummaryThe macro data from the past month continues to mostly point to positive growth. On balance, the evidence suggests the imminent onset of a recession is unlikely.

The bond market agrees with the macro data. The yield curve has 'inverted' (10 year yields less than 2-year yields) ahead of every recession in the past 40 years (arrows). The lag between inversion and the start of the next recession has been long: at least a year and in several instances as long as 2-3 years. On this basis, the current expansion will last into late 2018 at a minimum. Enlarge any image by clicking on it.